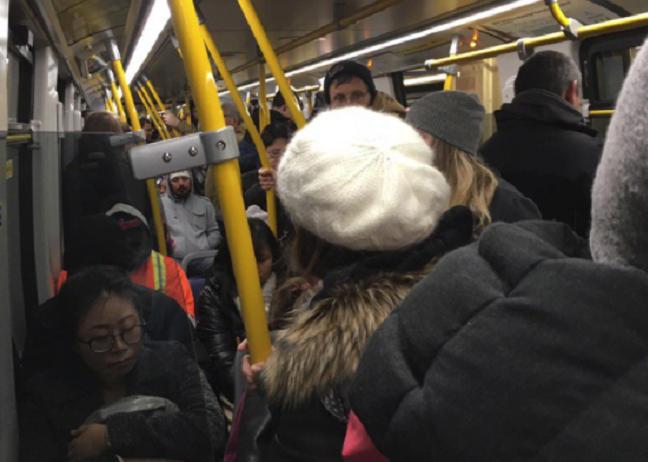
With TransLink ridership surging to record levels, anyone who’s hopped on Metro Vancouver transit lately has probably felt the squeeze from time to time.

If you’ve felt like you’re rubbing elbows with other commuters rather often, now you can compare just how sardine-like your travel route is.
TransLink has released new data from its 2017 Transit Network Performance Review, which it describes as a “report card on transit service.”
As a part of the review, the transportation agency has broken down the top 10 most-used SkyTrain stations and bus routes, 10 most-crowded bus routes and 10 bus routes with the biggest growth.
WATCH: New TransLink technology will make it easier to take transit

TransLink by the numbers
Taking the top slot for most popular SkyTrain station was Waterfront, with 37,500 average weekday boardings. Commercial-Broadway station was number two, with 24,900 average weekday boardings and Burrard Station was number three with 23,000.
On the bus routes, the 99 B-Line, serving UBC to Commercial-Broadway station was unequivocally the most-used, with more than 17.4 million boardings per year.
The 41 UBC to Joyce-Collingwood Station was number two, with 8.9 million annual boardings and the number 20 Downtown-Victoria route saw 8.6 million.

Get breaking National news
WATCH: New fare structure for TransLink could cost more

When it came to measuring the squeeze-rate on the region’s bus routes, the 99 B-Line took top honours as well.
TransLink says that UBC to Commercial-Broadway Station route saw 39,500 annual revenue hours with overcrowding last year, or 33 per cent.
The 49 UBC to Metrotown Station route took the number two slot with 17,800 overcrowded revenue hours, or 19 per cent, and the 25 UBC to Brentwood Town Centre saw 17,200, or 17 per cent.
READ MORE: Transit fares going up across Metro Vancouver on Canada Day
The bus routes that saw the biggest growth were the 96 B-Line from Guildford Exchange to Newton Exchange, the 49 UBC to Metrotown Station, and the 319 Scott Road Station to Newton Exchange.
You can dig into the data yourself here.
WATCH: TransLink CEO talks about Metro Vancouver 10-year transit plan

TransLink CEO Kevin Desmond said with ridership up six per cent over last year, customer service is the top priority.
“What we’re doing here in 2018, and what’s coming for the rest of the year is customer experience and building public support,” he said.
“Our goal is to maintain the livability of our region, our strategy and programs are designed to support that goal.”
The numbers capture a period following the implementation of Phase One of the TransLink Mayors’ Council’s 10-year transit plan.
That included a 10 per cent increase in bus service and the creation of five new B-Line routes, the purchase of 80 new SkyTrain cars and a new SeaBus.
TransLink also recently announced the creation of four new B-Line bus routes.
Funding has also now been locked down for Phase Two of the plan. It will include more buses and light rail transit (LRT) for Surrey and a subway along Broadway in Vancouver, which could take some pressure off that often-packed 99 B-Line route.
10 most-used SkyTrain stations
Average weekday boardings
- 1. Waterfront (Canada and Expo Lines): 37,500*
- 2. Commercial–Broadway (Expo and Millennium Lines): 24,900
- 3. Burrard (Expo Line): 23,000
- 4. Granville (Expo Line): 20,600
- 5. Metrotown (Expo Line): 19,900
- 6. Vancouver City Centre (Canada Line): 18,400
- 7. Stadium–Chinatown (Expo Line): 16,200
- 8. New Westminster (Expo Line): 14,800
- 9. Broadway–City Hall (Canada Line): 14,500
- 10. Main Street–Science World (Expo Line): 14,300
*This is the first year the Canada Line has been incorporated with Expo Line.
10 most-used bus routes
Annual automatic passenger counter (APC) boardings
- 1. 99 UBC/Commercial–Broadway Station: 17,421,000
- 2. 41 UBC/Joyce–Collingwood Station: 8,918,000
- 3. 20 Downtown/Victoria: 8,630,000
- 4. 49 UBC/Metrotown Station: 8,034,000
- 5. 25 UBC/Brentwood Town Centre Station: 7,642,000
- 6. 16 Arbutus/29th Avenue Station: Vancouver/UBC 7,549,000
- 7. 9 UBC/Alma/Granville/Commercial–Broadway Station/Boundary: 7,273,000
- 8. 3 Downtown/Main: 6,724,000
- 9. SeaBus: 6,343,000
- 10. 106 Edmonds Station/New Westminster Station: 6,212,000
10 most-crowded bus routes
Annual revenue hours with overcrowding (percentage of ARHs with overcrowding)
- 1. 99 UBC/Commercial–Broadway Station: 39,500 (31 per cent)
- 2. 49 UBC/Metrotown Station: 17,800 (19 per cent)
- 3. 25 UBC/Brentwood Town Centre Station: 17,200 (17 per cent)
- 4. 41 UBC/Joyce–Collingwood Station: 15,800 (18 per cent)
- 5. 14 UBC/Hastings: 11,900 (14 per cent)
- 6. 410 Railway/22nd Street Station 9,900 (18 per cent)
- 7. 130 Metrotown Station/Hastings/ Kootenay Loop/Phibbs Exchange/Capilano University9,400 (16 per cent)
- 8. 250 Horseshoe Bay/Vancouver 8,900 (8 per cent)
- 9. 257 Horseshoe Bay Express/Vancouver 8,500 (14 per cent)
- 10. 16 Arbutus/29th Avenue Station: 8,400 (8 per cent)
10 bus routes with the most growth
Increase in annual automated passenger counter (APC) boardings
- 1. 96 B-Line Guildford Exchange/Newton Exchange: 757,436
- 2. 49 UBC/Metrotown Station: 643,000
- 3. 319 Scott Road Station/Newton Exchange: 543,000
- 4. 3 Downtown/Main: 528,000
- 5. 100 Marpole Loop/22nd Street Station: 497,000
- 6. 10 Downtown/Granville: 478,000
- 7. 410 22nd Street Station/Railway: 429,000
- 8. SeaBus: 414,000
- 9. 16 Arbutus/29th Avenue Station: 409,000
- 10. 99 B-Line UBC/Commercial–Broadway Station: 389,000


Comments