
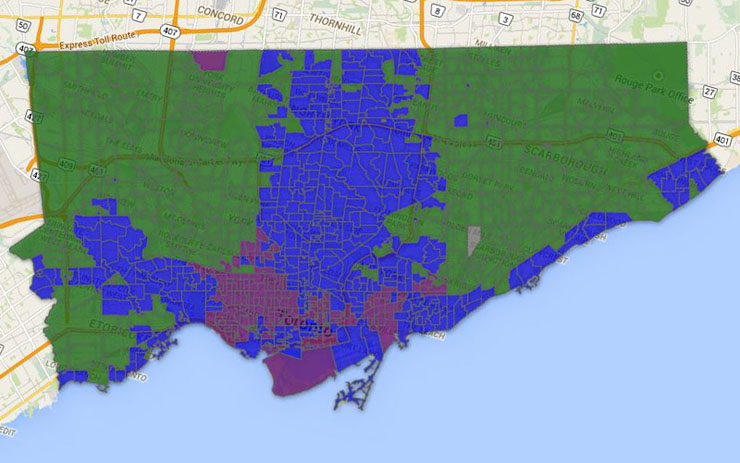
Data released by the City of Toronto today shows Monday’s election in a far greater level of detail than was possible on election night. Poll-level maps show voting patterns broken down by over 1,200 polling districts across the city.

Doug Ford’s top poll was along Rexdale Blvd. west of Islington Ave, not far from Steak Queen. John Tory’s top poll was in Forest Hill, north of Spadina Rd. and St. Clair Ave. W., not far from Upper Canada College. Olivia Chow‘s top poll? The Toronto Islands, where 283 out of 357 voters from Ward’s and Algonquin Islands backed the third-place finisher.
The detailed data shows that Chow did well not only in the NDP’s well-defined downtown stomping grounds (plus York University), but also in the Yonge St. high-rises north of Sheppard, one of the most densely-populated areas in Canada.


Tory did best in well-established, wealthy neighbourhoods in midtown: Rosedale, Forest Hill, Lawrence Park.
Ford did best in northern Etobicoke, with secondary pockets of support in lakeshore Etobicoke and Scarborough away from the lake.
Although almost completely shut out of the older city, Ford did take a few polls in the east downtown, in Moss Park and in a few highrises along Sherbourne and Jarvis. He also had a solid pocket of support in East York, in polls centred on Pape and Cosburn. He also did well in an apartment building on Windermere Ave. in Swansea.
More to come.
Comments