With winter officially in our rear view mirror, we can take a look back and see how we fared relative to normal winters by comparing temperature and precipitation statistics.

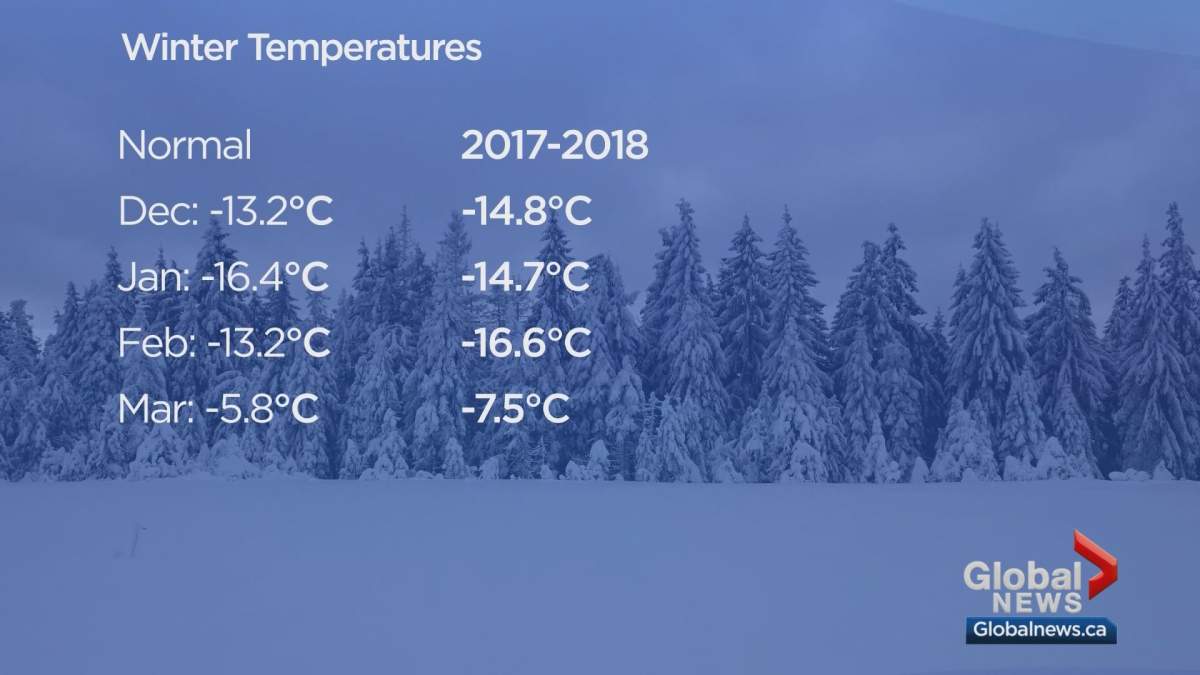
Starting with temperatures, here is how Winnipeg compared to average temperatures from December through to March 19.
Overall, temperatures have stayed close to normal. February was colder than normal but it was far from a record setter. If you remember the cold February from 2014, the daily mean temperature there was -20.0 degrees Celsius.
We were also close to normal for days below -30° C. From December through February, temperatures will typically drop to -30° C or colder 11 times with this happening 6 times in January. The winter of 2017/2018 had temperatures falling below this mark 10 times but 7 out of the last 8 days in December. This was during a stretch of weather where Extreme Cold warnings seemed to blanket most of the country.

Get daily National news
RELATED: Christmas in and around Winnipeg will be colder than the North Pole
Precipitation wise, as you might expect, we were below normal amounts.
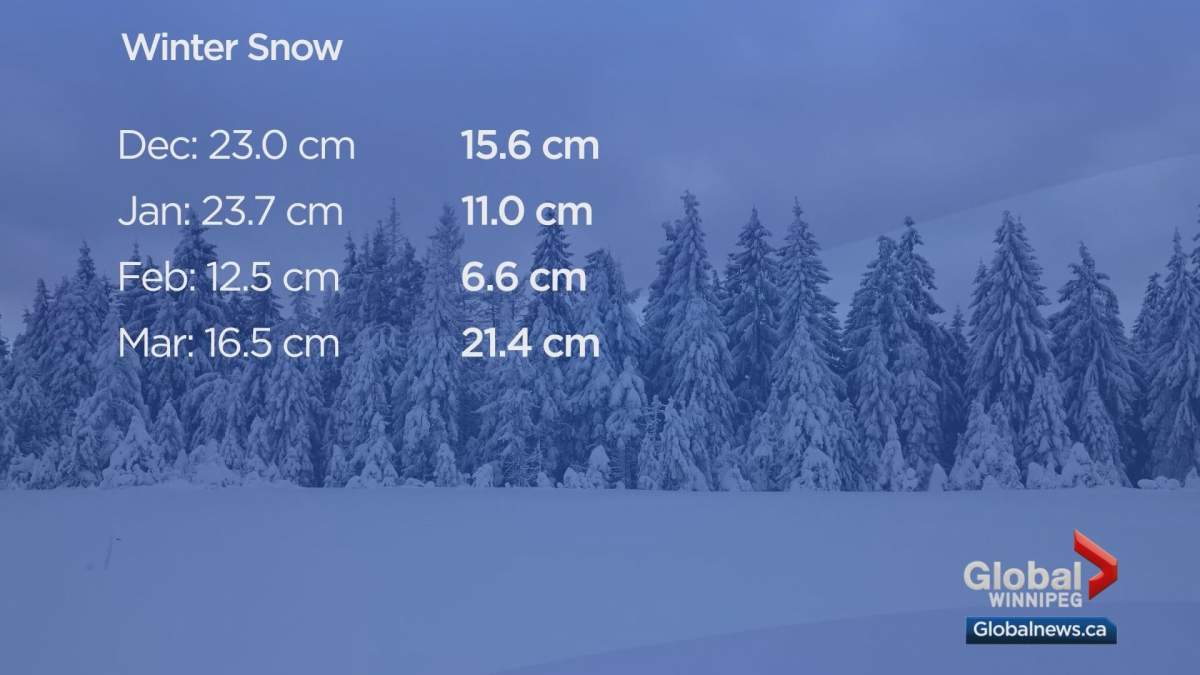
In the left column of this graphic, you can see normal snow amounts. The right column shows what actually fell.
Every month this winter has had below normal precipitation amounts with March being the exception. This is all thanks to the snowfall from March 4-5 which dumped approximately 22 cm of snow on Winnipeg.
If you add up what the normal precipitation amounts should be from December through March, you will notice that Winnipeg comes up short by 21.1 cm.
So, in order for Winnipeg to get to normal snowfall amounts, we would essentially need a second major snowstorm before the end of the month.


Comments