Some of the toniest neighbourhoods in Canada’s least affordable city are losing people at an accelerated rate.

That much is clear from Census data released Wednesday, which showed populations dropping in various areas on Vancouver’s west side, traditionally seen as the city’s most affluent area, compared to other neighbourhoods.
READ MORE: How has your city grown? Find your neighbourhood
A series of maps produced by Jens von Bergmann, a data illustrator with MountainMath Software, hit this point home.
One of them, which looks at relative population change from 2011 to 2016, shows a number of Census tracks along Granville Street in red – suggesting that the population there has dropped far more significantly than it has elsewhere.
A Census tract bordered by Granville Street to the east, West 41st Avenue to the south and West 16th Avenue to the north, for example, saw its population fall by 6.9 per cent since 2011.
Meanwhile, another tract, bordered by Granville Street, West 49th Avenue and West 57th Avenue saw its population drop by 6.8 per cent.
READ MORE: Census 2016: Canadians embrace downtown living
There are a few reasons why this happened, von Bergmann told Global News.
One of them is that many of these neighbourhoods are dominated by single-family homes, and household sizes in these areas are dropping.
“I think it’s fair to say that one thing that is happening is that people are getting older and the kids are moving out,” he said.

Get breaking National news
“And new people that are moving in are not coming in at the same rates with kids as the old ones.”
And unaffordable housing, von Bergmann added, “might have something to do with that.”
READ MORE: Census 2016: Urban spread continues – but at what cost?
Indeed, in the latter tract, some homes have seen their household sizes fall by as many as 0.29 people since 2011 — this number was on the higher end of household size declines across the city.
Andy Yan certainly thinks affordability is a factor in populations dropping on the west side.
The director of SFU’s City Program saw similar trends in Richmond, where one area bordered by Steveston Highway, Gilbert Road, Williams Road and Railway Avenue saw its population drop by 7.9 per cent in the Census.
This area, which is also populated by single-family homes, saw household sizes fall by as many as 0.17 people.
“I think the fact of the matter is, that it’s housing that isn’t really affordable for local incomes,” Yan told Global News.
“You have people whose families have grown out of the home … the people who are moving in are probably smaller households than were there before.”
But richer areas bleeding residents wasn’t the only fact the Census revealed about Vancouver.
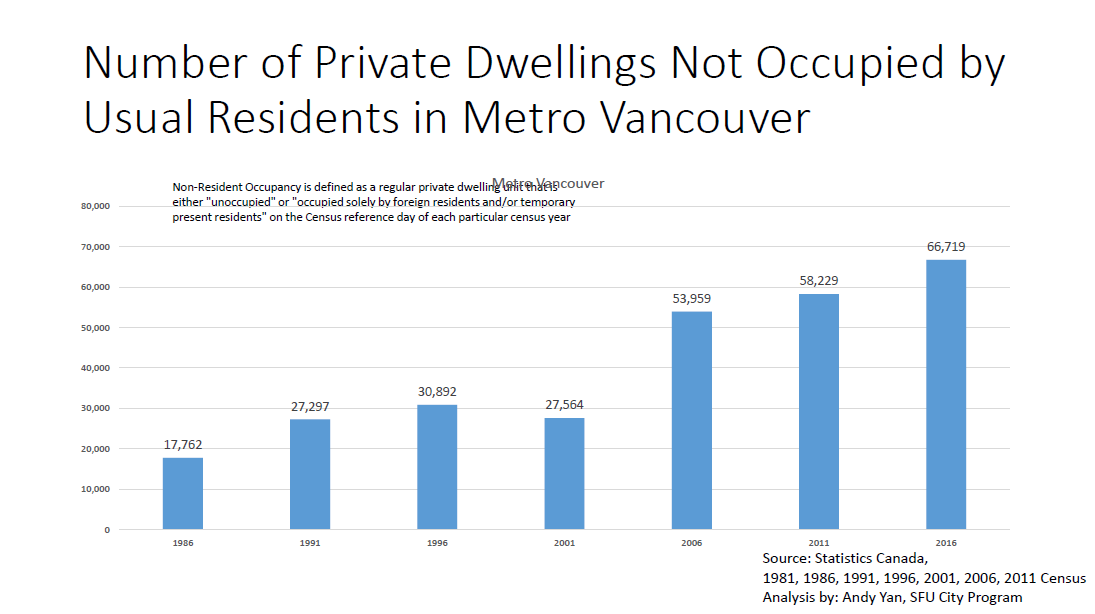
The number of non-resident occupied dwellings across Metro Vancouver grew by about 15 per cent since the 2011 Census, from 58,229 to 66,719.
Such dwellings are defined as those that are either unoccupied or “occupied solely by foreign residents and/or temporary present residents” on a particular Census day.
In other words, they’re being left empty, or occupied by foreign or temporary residents.
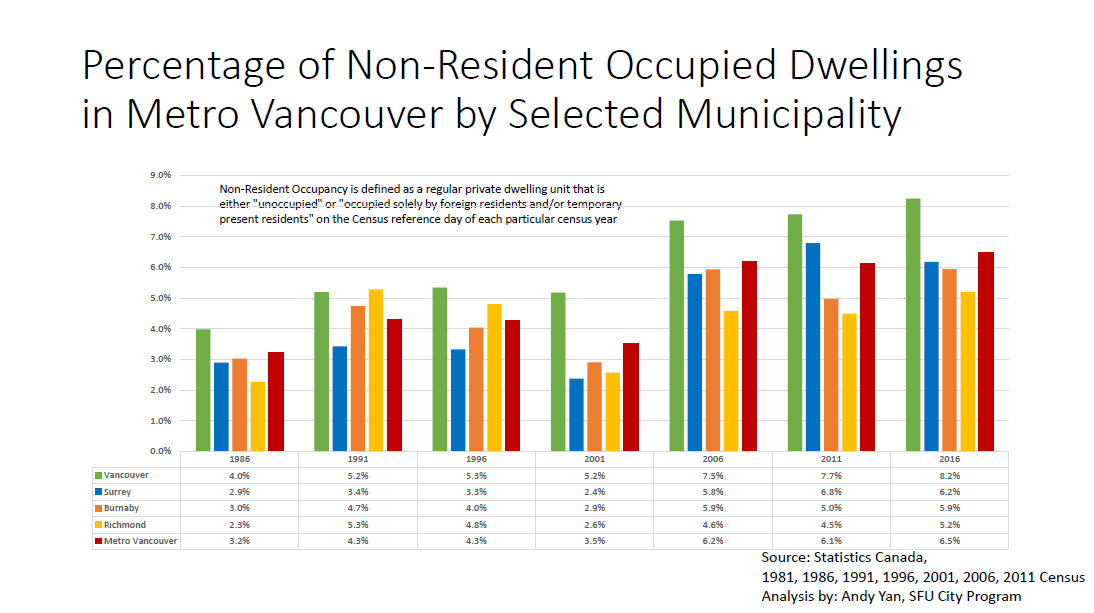
The increase in such dwellings was most pronounced in the City of Vancouver, where they grew by 25,502 units (8.2 per cent) in the past five years.
The increase surprised Yan — he thought that the number of non-resident occupied dwellings might go down because he expected new apartment units to be “worn in by their full-time permanent residents.”
But as von Bergmann noted, new apartments often take time before they become occupied.
“As stock gets older it fills in more,” he said.
But Yan has another possible explanation for the growth of non-resident occupied homes: “What we can also see is, in this time frame, from 2011 to 2016, is the full effect of short-term rentals, and really how that has kind of entered as a reality and a dynamic in our housing markets.”
READ MORE: Vancouver passes tax on empty homes
Airbnb and sites like it have been enough of an issue that certain municipalities have taken steps to limit them within their boundaries.
Richmond, for example, has enacted a ban on short-term rentals amid concerns about affordability.
And the City of Vancouver has approved a one per cent tax on empty homes in an effort to free up more rental housing.

The number of non-resident occupied homes in Vancouver stood in contrast to empty homes data reported by the city.
A 2014 study found 10,800 empty homes out of 225,000 studied, based on electricity consumption.
Yan chalked the difference up to varying methodologies in their studies.
“It’s not to say it’s any worse or any better, but it’s just different,” he said.
- B.C. First Nation opposes cull on its territory after footage of ‘Judas’ wolf
- Father of Tumbler Ridge school shooter issues statement: ‘I carry a sorrow’
- ‘We now have to figure out how to live life without her’: Mother of Tumbler Ridge shooting victim speaks
- They ‘ran into gunfire’: Impact of the Tumbler Ridge shooting on first responders


Comments
Want to discuss? Please read our Commenting Policy first.