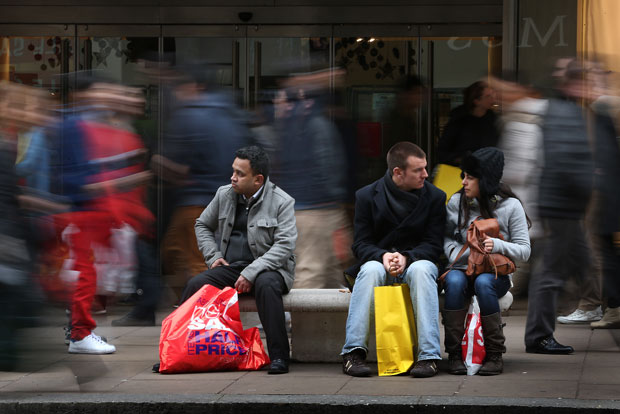
While it’s true that many of us have spent the last several years running up credit cards, lines of credit and other forms of debt while enjoying low interest rate payments, households make more than they are spending.

Fresh data released Wednesday shows that expenses for “average households” sit just under $75,500 a year, according to Statistics Canada.
It’s a catch-all sum that covers everything from the basics, such as food, shelter, transportation and taxes to what some may consider perks, such as cellphone and Internet costs and even gifts.
That figure compares to average annual household incomes of $79,600, according to Statistics Canada – meaning there’s a sizable surplus between what we make and what we spend.
So does that mean Canadians are in fact a nation of savers, after all? Absolutely not.
“The household spending costs do not account for debt repayments on credit cards and student loans” or other forms of debt, a spokesperson for the government agency said.
- A ‘zombie’ virus is raging among raccoons. What to know
- Ultra-processed food tied to higher risk of early death, study finds. What to avoid
- N.S. couple felt they won ‘doctor lottery’ after years on wait-list. Now they’re back on it
- Panera to remove ‘Charged Sips’ drink from Canada amid wrongful death lawsuits
That means for many, the balance between income and expenses at their household is being entirely gobbled up (and then some) by payments toward credit cards, bank loans and payments on that 2012 Mazda3 sitting in the driveway.
More findings from Statscan on Canadian spending habits:
- Canadian households spent an average of $56,279 on goods and services in 2012, up 2.0% from 2011.
- Spending on shelter accounted for the largest share, at 28.1%, followed by transportation (19.9%) and food (13.8%). “These shares were little changed from 2011.”
- Provincially, the highest average spending on goods and services was by households in Alberta at $69,870, followed by households in British Columbia ($58,808). Households in Quebec reported the lowest average spending at $48,870.
- Couples with children had the highest average spending on goods and services ($80,056) of all household types. One-person households headed by a senior aged 65 years or older had the lowest average spending ($27,546).


Comments