
OTTAWA – In an age of highways and Hummers, 6,445 Canadians have to cross water to get to work.

And that means they take the ferry.
Most of them, almost 2,800 people, live in British Columbia. More than 1,200 are in Ontario, almost 1,000 in Quebec, 855 in Nova Scotia, 260 in Alberta, 115 in Saskatchewan, 100 in Newfoundland, 75 in Manitoba and 70 in New Brunswick.
The highest number in a city – all of 820 people – are in Halifax.
An average commute time by ferry is the longest for public transit, too – at 48.6 minutes, each way.
That tidbit about the Canadian workforce is included in the 2011 National Household Survey released Wednesday which for the first time collected details about how we use public transit.
Statistics Canada senior analyst Martin Turcotte said the data was requested by urban planners.
“It helps plan better to develop services more efficiently,” he said.
In total,1.85 million people in 2011 took transit to work.
Bus is still the most popular mode, at 63.5 per cent, followed at 25 per cent by subway or elevated rail, 11.2 per cent by light rail/streetcar or commuter train, and 0.3 per cent by ferry.
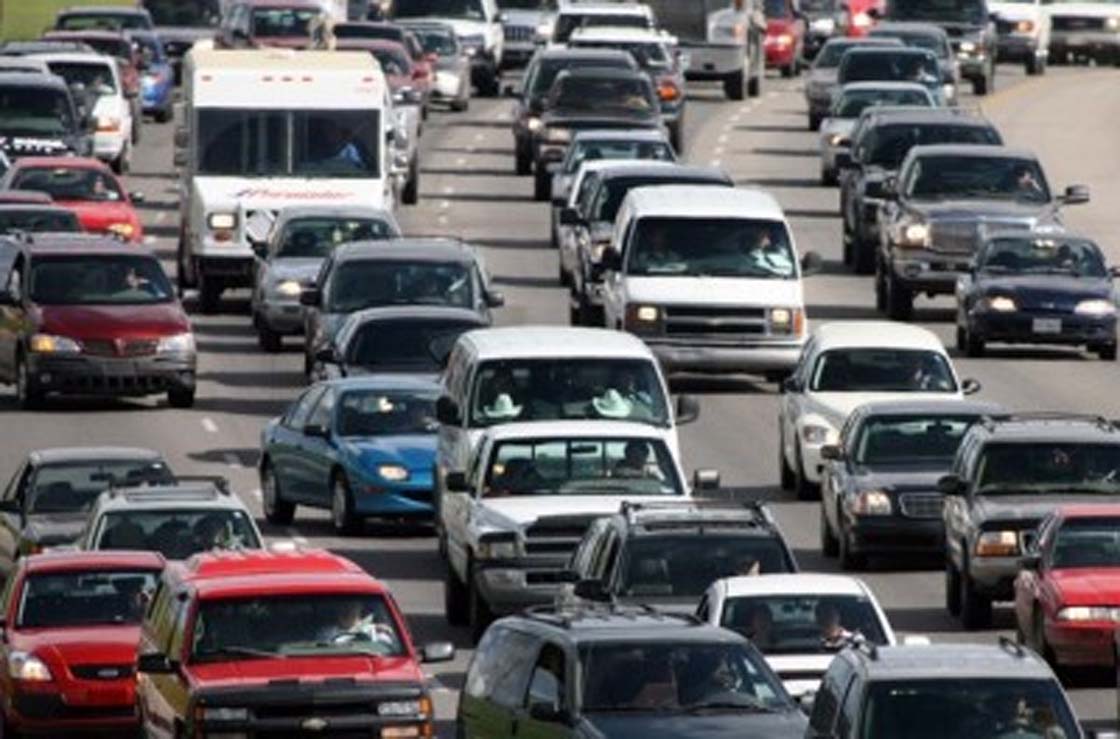
But make no mistake, most Canadians are still slaves to the car (or van, or truck).
Of the 15.4 million Canadians who commuted to work, 11.4 million drove to work and another 867,100 made the trip as passengers.
In total, 4 out of 5 Canadians used private vehicles.
“The vast majority of people use a car to get to work,” said Turcotte.
Another 880,800 walked to work (5.7 per cent) and 201,800 cycled (1.3 per cent), compared to 6.4 per cent and 1.3 per cent in 2006, respectively.


The use of public transport went up slightly in the past five years: 12 per cent in 2011, compared to 11 per cent in 2006.
“When you start at a low proportion a small change like that is still significant,” said Turcotte.
But public transit is still – how do we put this – slow.
It takes, on average, 40 minutes each way for bus riders, 44.6 minutes for subway users and 52.5 minutes for light rail, streetcar and commuter train passengers to get to work, compared to 23.7 minutes for those who travel by vehicle.
Public transit numbers include walking and waiting times.
Walkers and cyclists took the least time – on average, 12.7 minutes for walkers and 20 minutes by bike.
The longest trips to work by car were in Toronto (32.8 minutes), Oshawa (31.8 minutes) and Montreal (29.7 minutes), slightly less than the longest average time in the United States reported in New York-Northern New Jersey-Long Island (34.7 minutes).
In 2011, the average commute to work was 25.4 minutes, almost the same average as the U.S. (25.5 minutes).
But that’s just the average.
The survey reported 17.2 per cent of commuters took 45 minutes or longer to get to work, with most of them in the Toronto area. Almost 30 per cent in Oshawa, 28.4 per cent in Toronto and 26.6 per cent in Barrie spent 45 minutes or more getting to work.
The shortest commuting time was in Saguenay, Que., at 16.9 minutes – which also happens to have the most people travelling to work by vehicle.
Following close behind was Thunder Bay, Ont., at 17.1 minutes, and Moncton at 17.2 minutes.
The survey said public transit availability increases with the size of area.
Torontonians and Montrealers, who live in the country’s most populous areas, were most likely to take transit (23.3 per cent in Toronto, 22.2 per cent in Montreal).
In Ottawa-Gatineau, it was 20.1 per cent, and in Vancouver 19.7 per cent.
And 99 per cent of those in Ottawa travelled by bus, compared to 51 per cent in Montreal, 45.4 per cent in Toronto.
In Edmonton and Victoria, fewer people took transit. The Alberta city had a high percentage of drivers and passengers (82.2 per cent), while the capital of B.C. had the highest percentage of walkers and bikers.
“Active transportation” was most common in Victoria, where 10 per cent of people walked and 5.9 per cent biked. Halifax and Kingston also had a high proportion of walkers at 8.5 per cent. Cyclists were above average in Kelowna, B.C. (2.6 per cent) and Ottawa-Gatineau 2.2 per cent.
The highest proportion of vehicle commuters – as either drivers or passengers – live in Abbotsford-Mission, B.C., where 92.2 per cent of people get to work in a car, truck or van. That’s down one per cent from 93.2 per cent in 2006.
Most drivers live in Saguenay, Que., where 91.6 per cent of the population drives a vehicle to work.
“It’s a smaller (area), and there’s a clear pattern and relationship between a size of an area and availability of public transit,” said Turcotte.
The lowest proportion of cyclists live in St. John’s and Saint John, N.B., where only 0.2 per cent take a bicycle to work. That’s down from 0.3 per cent respectively in 2006.
Most people who take cars are the sole drivers: 83 per cent drove alone, while 17 per cent carpooled.
The highest carpooling rates were in Eastern Canada: Halifax, St. John’s and Moncton, at about 23 per cent each.
The lowest carpooling rates were in Quebec: Saguenay (11 per cent), Trois-Rivieres (11.3 per cent) and Sherbrooke (12.7 per cent.)
Comments