
WATCH: For most it’s the action, fighting and scoring that people love about hockey, but for Micah Blake McCurdy it’s all about the numbers.

HALIFAX – Micah Blake McCurdy isn’t a typical Canadian whose childhood Saturday nights were spent parked in front of the television to watch hockey.
The 31-year-old father of two who lives in Halifax only started to take an active interest in the game as an adult while studying in Australia for his PhD in category theory — a “kind of pure math”, he says — almost a decade ago. Already well-educated with an extensive background in mathematics, his ears would perk up when the broadcasters’ conversations turned to numbers.
“Every time they would say something about a probability, I would wonder if it was true or not,” he said. “So I’d get out a pen and paper and start to figure it out.”
The on-air personalities would speak about statistics authoritatively, although they were often incorrect, he found.
“Once you start thinking like this, you can’t stop,” he said. “Because of course the people on the TV have to talk for a living. Once you get your appetite whetted for this stuff, you realize they were wrong with one thing, then you check another thing and they’re wrong about that. It sort of spiralled out from there.”
Eventually, the problems McCurdy was trying to solve were complex enough that he turned to computers — not just to crunch the numbers, but also to download the mountains of information he needed to feed the mathematical models he was building. He started writing his own programming scripts to fetch the data and convert it to a format he could then use to generate colourful charts.
He says people became interested in seeing his data visualized, so he began to create more charts as a way to make sense of all the information he was processing. Then he started to share them on the internet.
These days, McCurdy is best known on Twitter, where his account @IneffectiveMath has almost 4,000 followers. (The nickname is a shortened form of “Ineffective Mathematician”, an idea he got from a former colleague who self-identified as an ineffective workaholic, which McCurdy says couldn’t be further from the truth.) He says he produced thousands of charts throughout the 2014-15 hockey season, many at the request of fans. Some charts are descriptive in nature, meaning they break down events from games that have already been played. Other charts are predictive, forecasting probabilities for various outcomes, such as how likely it is a team will qualify for the Stanley Cup playoffs.
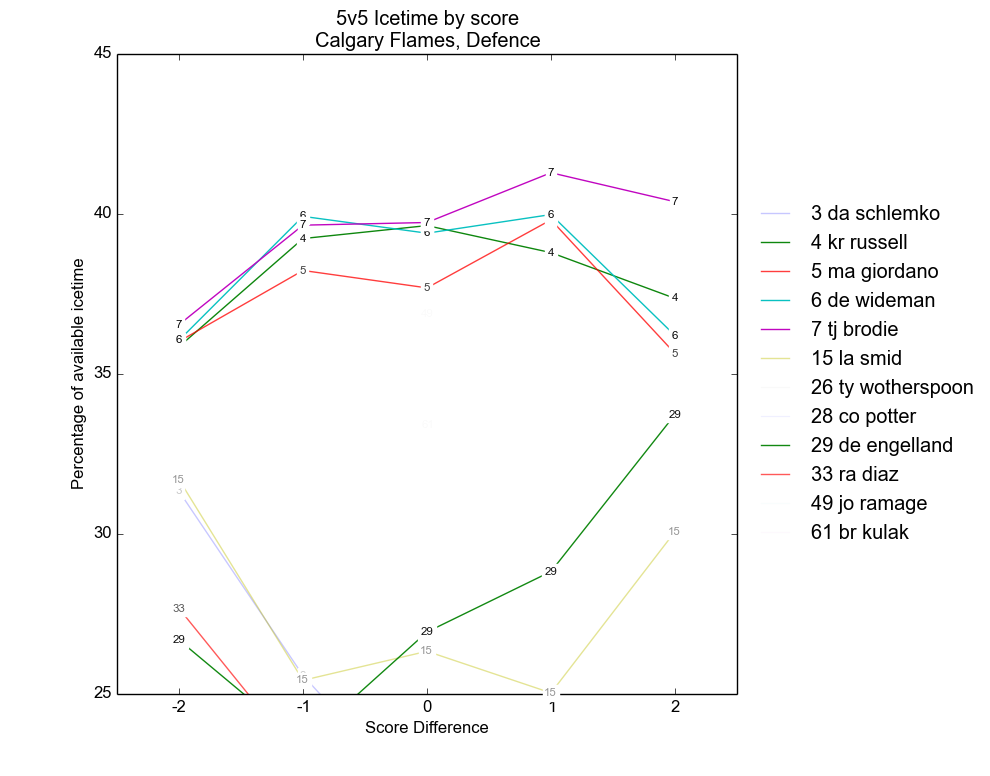
PHOTO: A chart created by McCurdy showing the ice time of Calgary Flames players depending on the score of the game.
- Canadian man dies during Texas Ironman event. His widow wants answers as to why
- ‘Shock and disbelief’ after Manitoba school trustee’s Indigenous comments
- Several baby products have been recalled by Health Canada. Here’s the list
- ‘Sciatica was gone’: hospital performs robot-assisted spinal surgery in Canadian first
He says the outcomes his models achieve are “about as good” as what people can expect if they bet with the bookkeepers because “prediction is an art as well as a science.” Knowing which elements to include in a model can be tricky, but the more he learns about the predictive powers of each element, the better the models become.
The main purpose of analyzing the data is to figure out what players contribute the most to their team’s success. McCurdy says it can be surprising to see who’s making a positive impact on the ice, because it doesn’t always line up with traditional analysis, which is less reliant on statistics.
“A lot of players have really good reputations for being good defensive players,” he said, citing it as an example because those reputations “only come out because the player is in the defensive zone all the time.
“Even though they’re making good defensive plays…when they’re on the ice, their team is only ever playing in the defensive zone. So those players are quite harmful to their teams even though they appear very good when you watch them.”
A backlash occurs, he says, because some people interpret it as analytics picking on a player who’s a fan-favourite.
“A lot of these players are heart, grit and soul-types that fans love, and it’s not so obvious that they’re hurting their teams,” he said.
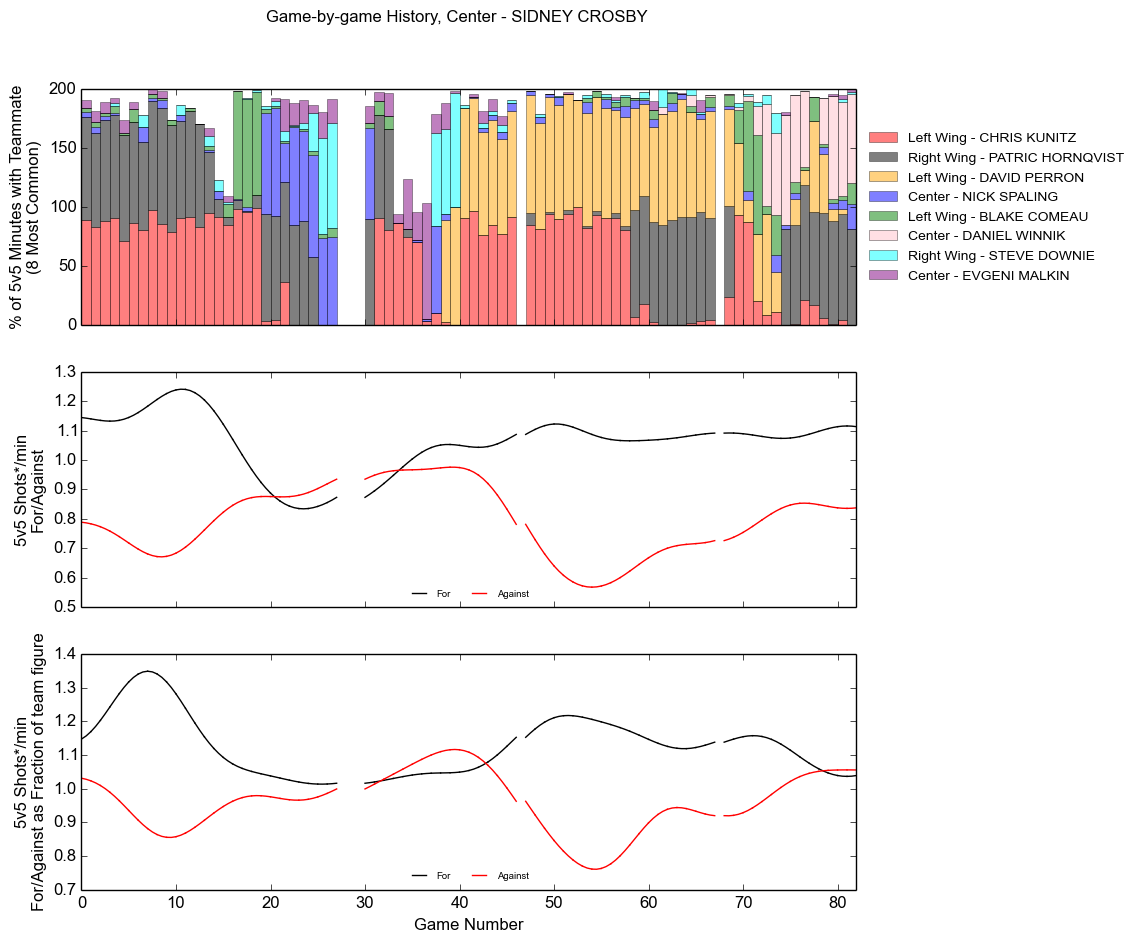
PHOTO: A chart created by McCurdy showing a game-by-game breakdown of Sidney Crosby’s linemates, and how many shots the Pittsburgh Penguins generate and surrender when he’s on the ice.
The tension between the analytical approach to hockey and the more traditional scouting-based approach, known colloquially as the eye test, reached a critical mass at the professional level last summer. Over the past decade, a number of NHL teams had quietly been investing in various forms of analysis in an attempt to gain a competitive edge. Although many were reticent to discuss their investments at length or even acknowledge them, others were very vocal about their opposition to what they viewed as overly simplistic spreadsheet-driven evaluation. The Toronto Maple Leafs notably doubled down on an analytics-hostile position in the face of numerical evidence that suggested the team’s success in 2013 would not continue.
After missing the 2014 playoffs following a late-season collapse, the Maple Leafs’ front office did an about-face and made a series of well-publicized hires to bolster a newly formed analytics team. Among the additions were the operator of a prominent website that published advanced hockey statistics and 28-year-old Kyle Dubas, general manager of the Sault Ste. Marie Greyhounds in the Ontario Hockey League, who found success with a non-conventional approach to team-building.
READ MORE: Wide-open NHL playoffs means it’s anyone’s Cup
The seeds for the growth of analytics in hockey had been sown years before, however, when pseudonymous bloggers researching the sport found certain events during the course of a hockey game more accurately predict future results than the goals registered on the score sheet. One term in particular managed to permeate the mainstream lexicon — Corsi, or the number of total shot attempts taken by a team or player, which is used as a proxy measure for puck possession time. Its clout in analytics circles comes from its superiority compared to goals and wins in determining what teams can sustain success. The larger a team’s Corsi share, the more it is controlling the play on the ice, which tends to lead to better results. It’s a statistic even casual fans will probably be familiar with if they have tuned in to watch a hockey broadcast in the past year.
Corsi is, however, just the tip of the statistical iceberg. As an increasing number of people have taken an interest in finding new ways to measure the game, the quest for better understanding has led to the development of new models, new metrics and, as in McCurdy’s case, new fans.
McCurdy turned to the internet, and eventually social media, to discuss his interpretations of the game because it was virtually impossible to watch live hockey in Australia. It’s an old habit that still carries over to his current household, where he doesn’t subscribe to broadcast TV and catches the games he wants to see online.


Using social media while watching the games is a good way to learn, if you know how and who to engage, he says.
“I went from knowing a little bit about hockey with a little bit of mathematics on the side, to a huge amount of knowledge just by picking up what was being out for free by intelligent people,” he said.
As someone who has spent the majority of his adulthood in the halls of academia — and still spends time there when he lectures part-time at Saint Mary’s University — McCurdy says social media acts as a “chaotic” form of peer review that rewards the best and brightest ideas.
“It’s actually been very heartwarming in a way to see what some people consider just to be fluff…turn into something that’s really driving our understanding of hockey forward,” he said.
He says the emerging desire to better understand hockey is a natural extension for a new generation of fans who are increasingly leaving traditional media for smartphones and web-connected apps.
“There’s lots of people who aren’t just sitting on their couch…and instead are watching using their phones from wherever they happen to be,” he said. “Those people, naturally they’ve grown up talking to people on Twitter about what they love, and the discussions on Twitter have a totally different character than what the commentators say. You get a totally different story of what goes on.”
PHOTO: A chart created by McCurdy that shows a game-by-game breakdown of the defensive pairings used by the Ottawa Senators during the 2014-15 season.

McCurdy’s own life story is also outside the norm for most Canadian hockey fans. Born in Miramichi, N.B., he spent his teen and undergrad years in Halifax, where he now lives. But interwoven among those stints are several stops in locales that aren’t known as hockey hotbeds. When he was six years old, his father, a minister, brought the family to Scotland and, a few years later, Romania. Between graduating from Dalhousie and heading to Australia for his doctoral studies, he received a Master’s degree at Cambridge University in England. After earning his PhD, he and his wife returned to Halifax to start a family.
Now they live in a quiet residential neighbourhood with their two young children, and McCurdy works for a local startup. He says sometimes it’s fun to contemplate what it would be like to put his skills to work for a professional hockey team or national broadcaster.
He says he could teach a general manager about the kind of information that could lead to smarter personnel decisions. If he worked for a broadcaster, he says he could keep engaging with and educating the public.
“I love to teach,” he said. “That’s part of why I spend so much time on Twitter.”
McCurdy admits that analyzing hockey can take from it some of the magic and mystique that attracts people to it in the first place. However, he says a better look into the factors that generate success on the ice will ultimately allow fans to engage with the sport on an entirely new level.
“I don’t think of it as a dry mathematical exercise,” he said. “I think analytics as a whole will cause people to be more emotionally connected to hockey, not less. Certainly I am.”
CapGeek founder also worked in Halifax
McCurdy’s work with hockey numbers calls to mind a project created by another local NHL fan. Halifax-based reporter Matthew Wuest operated CapGeek, a popular website that showed users how much teams were spending on player contracts. Wuest shuttered the site in January shortly before he died following a two-and-a-half year battle with cancer.
Throughout CapGeek’s existence, NHL commissioner Gary Bettman publicly derided its usefulness despite the legions of dedicated fans — and several members of the mainstream hockey media — who visited it on a regular basis.
Whether or not Bettman believes it was a mistake to shrug off CapGeek’s influence, the work of the hockey analytics community did not meet the same fate. In February, the NHL announced a multi-year partnership with software giant SAP to bring more advanced statistics to the league’s official website, and in doing so, formally acknowledged the foothold among fans that the relatively new metrics had secured.
Comments