
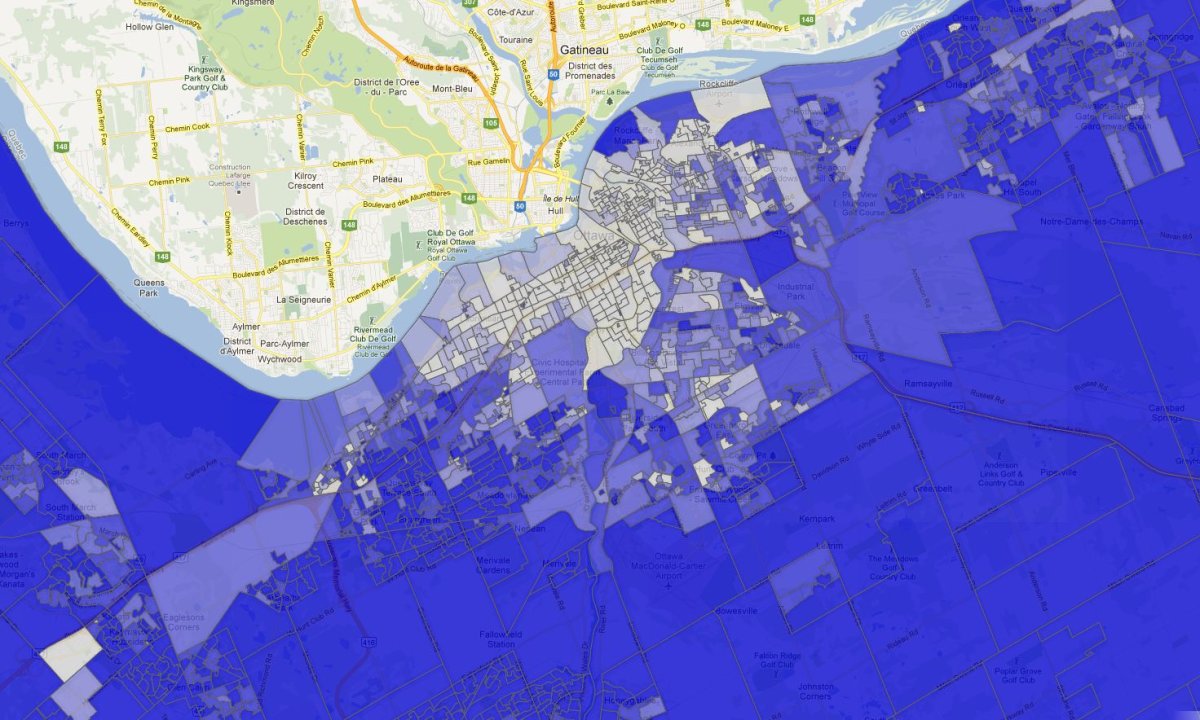
Just before Christmas, Elections Ontario released unoffical poll-by-poll results for the 2011 election. We crunched the numbers (which arrived in 107 spreadsheets), joined them with a geography file in Google Fusion Tables to create six maps: plurality winner by poll, voter turnout and four parties looked at in isolation. All polls may not be visible at all zoom levels. Advance polls are not included in the data. Each poll has a pie chart like the one seen at left. Use the pulldown menu to switch between maps, or enter an address to look at a community in detail.
Story: Toronto | Story: Ottawa (with OpenFile Ottawa) | Discussing this map on Twitter? Please consider the #onpoli hashtag.


More on Toronto
- Ontario NDP sets ultimatum for legislature keffiyeh ban, threatening to defy rules
- Muslim human rights activist in need of kidney finds help from Jewish community
- S&P/TSX composite rises, Nasdaq leads Wall St. rally after tech earnings
- Toronto officer charged with perjury, attempt to obstruct justice: police
Comments