
TORONTO – Researchers have revealed new insight into how the world communicates via Twitter by mapping the geography of Twitter.

The study, titled “Mapping the Global Twitter Heartbeat: The Geography of Twitter,” analyzed GPS data over 39 days of tweets between October and November 2012. That worked out to 1.5 billion tweets from over 71 million users, making up an average of 38 million tweets per day.
Researchers then used the data to build a geographic representation of the social network to map where tweets were coming from.
Using meta-data from the Twitter platform, along with exact latitude and longitude coordinates from iPhone and BlackBerry-based Twitter users, researchers were able to geo-locate about three per cent of users with varying preciseness.
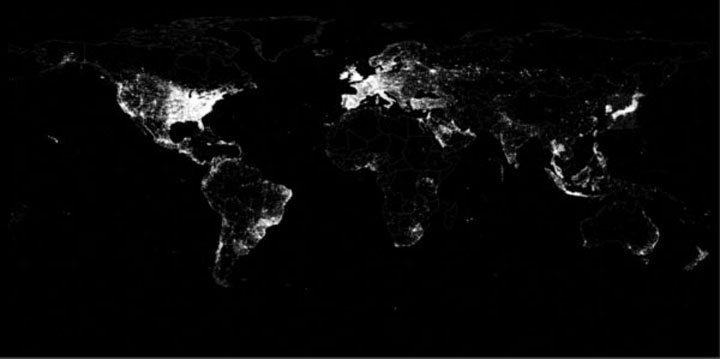
Those points where then plotted on a map to reveal stunning imagery of Twitter’s geography.
Photo Credit: “The Global Twitter Heartbeat: The Geography of Twitter,” study

Get breaking National news
“This map exhibits remarkable detail, tracing major road and transportation networks and demonstrating the ability of Twitter on mobile devices to trace society’s daily life,” read the study.


Canada, the U.S., Western Europe, Brazil, Mexico and Puerto Rico all have strong Twitter coverage, while most of Africa, Asia, Russia and Eastern Europe do not.
Researchers note that the outcome bared a striking resemblance to the NASA Visible Earth City Lights imagery, which mapped electric lighting at night across Earth, measured by satellite.
They then overlaid the image of the geo-referenced tweets with NASA’s imagry to show correlation.
“This results in a composite image in which bright white areas are those with an equal balance of tweets and electricity, while red areas have a higher density of tweets than night lights and blue areas have more night lights than tweets.”


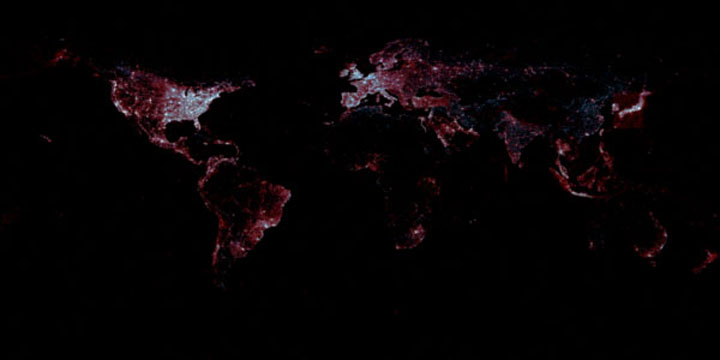
Photo Credit: “The Global Twitter Heartbeat: The Geography of Twitter,” study
The study also found that geographic proximity between Twitter users plays a very minimal role in who users choose to communicate or share information with. According to researchers the data shows that social media is, “shifting the communicative landscape.”
The average distance between connected users is 600 miles (956 kilometers) – almost the equivalent of the distance between Vancouver and Calgary.
Another interesting finding noted that Twitter content is produced by a small number of users.
The top 15 per cent of users made up 85 per cent of all tweets, while the top one per cent of users – approximately 720,000 users – produce 20 per cent of all tweets.
During the study about 25 per cent of users tweeted just once, while half tweeted one to four times.
Comments