CALGARY – The National Energy Board has launched an interactive map on its website that tracks spills and other pipeline incidents. The launch comes two years after Global News requested comprehensive incident data related to oil spills from both the provincial and federal governments, and received incomplete and unusable data from the NEB. It also comes a year and a half after CBC mapped the NEB data, after an access-to-information request that it noted contained “a number of blanks and inaccuracies.”

READ MORE: Crude Awakening -37 years of oil spills in Alberta
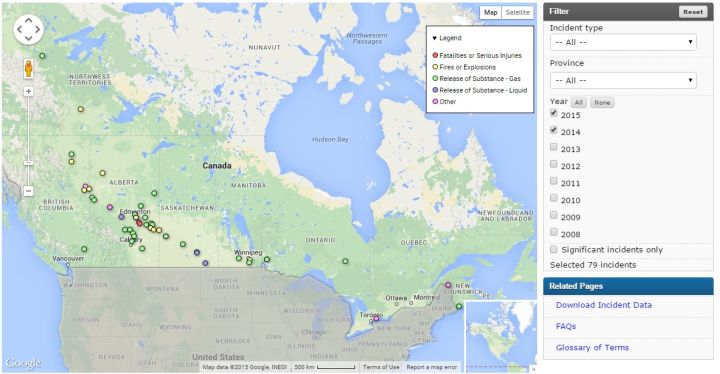
Users can filter the information by location, the company involved and volumes released in spills.
The map shows 692 incidents across Canada since 2008 – 45 of those deemed “significant.”
It denotes the type of incident – whether that be an oil spill, serious injury or fire – with a colour-coded dot over the location.
The NEB says map updates will be done quarterly, with the next one slated for July.
Peter Watson, who has chaired the federal energy watchdog since last August, says the new tool shows the board is increasing its commitment to transparency.
READ MORE: How informative is Alberta’s new oil incident and investigation database?
With files from Global News
Comments