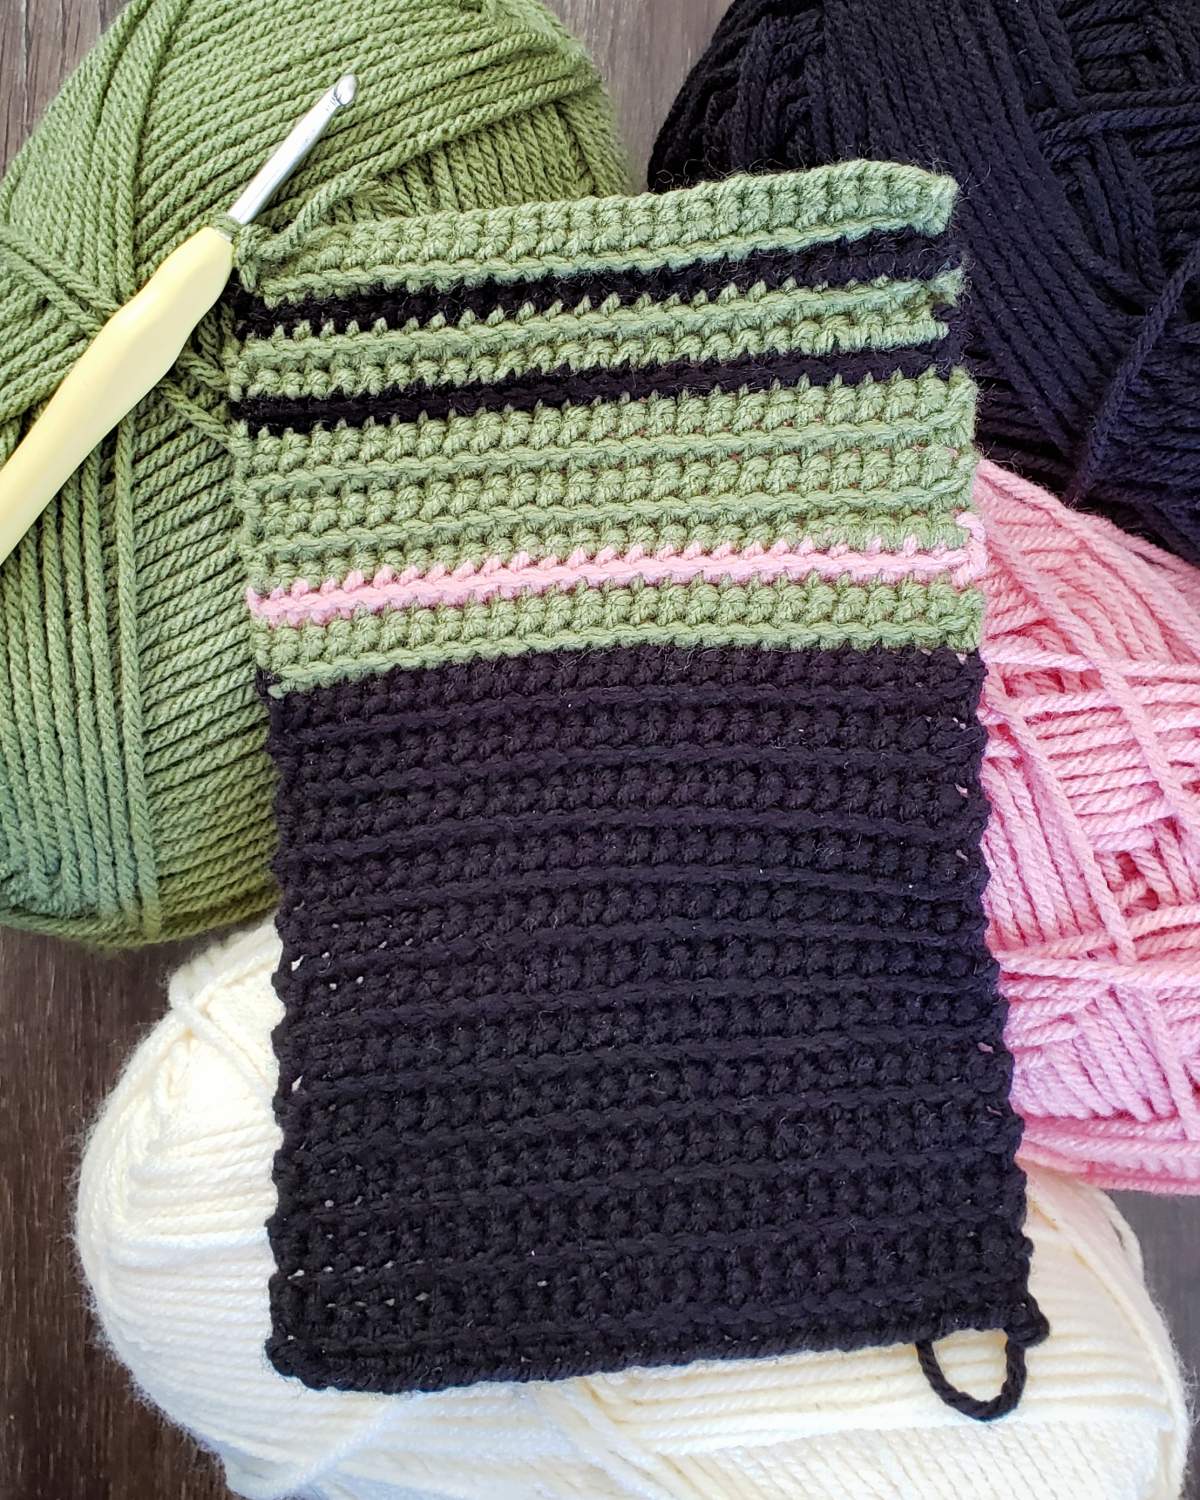
University of Alberta library staff have been tracking COVID-19 cases with yarn.

The group is “stitching the curve” to capture a unique moment in history. A colleague created a data spreadsheet for the group to work off of and are each assigned to track a province or territory.
Each row represents a day, beginning on March 1.
Darker colours represent fewer cases, the lightest colour on the pattern corresponds to one hundred cases and above and Hailey Siracky is knitting Alberta’s curve.
“It’s easy to get a sense of how the curve is working based on the colours we are all seeing in the knitting, even though we are all working with different colours,” Siracky said.
In total, 11 staff members are stitching COVID-19 cases across Canada (the territories are represented in one swatch).
Hanne Pearce, who is stitching the representation of B.C., said everyone’s experience has been different.

Get breaking National news
“B.C. has been a rollercoaster. It’s been very up and down,” Pearce said.
While some areas have seen a lot of new cases, Pearce said others who have been assigned to Maritime provinces have been knitting mostly dark rows.
“I keep telling them ‘It’s all important!’ Of course, we do want to see more darker colours and low numbers.”
Pearce said other patterns begin to emerge the longer they stitch.
“For example, when B.C. stopped doing weekend updates there’s nothing to report — so you see two lines that are dark, then you get a much lighter Monday line, because all of the new reports are coming in, then you get a few lower days that are average. That happens over and over again,”
She noted Canada Day as another significant marker.
“You can see over two or three weeks, the numbers start to go up again. It’s slow, but it’s happening.”
Once complete, the pieces will be stitched together into a blanket.
Pearce said she has reached out to the Royal Alberta Museum to see if it would like to display the homemade project.
“I believe at this point we have a pretty unanimous decision among our group members that’s where it’s going,” she said.
“Now that we know it will live on at the museum, it’s taken on a new meaning.”
If you’d like to “stitch the curve” outside of the main project, you can learn how here.


Comments