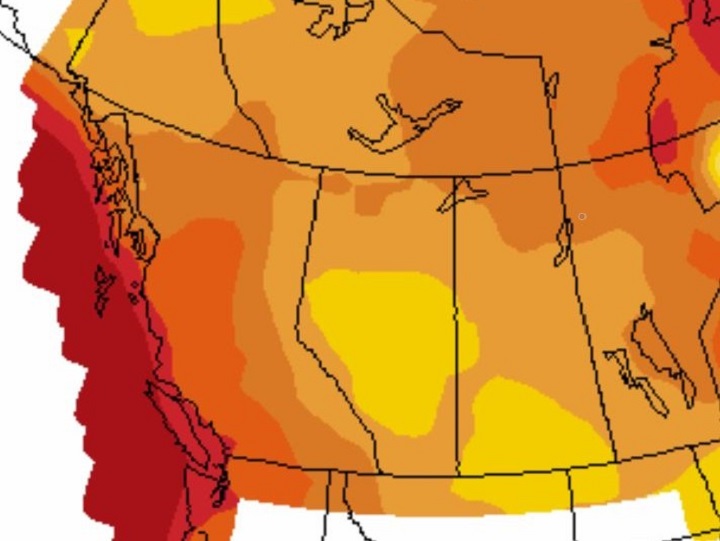
It was a wetter and hotter July than normal for some parts of British Columbia, according to Environment Canada statistics.

What this bodes for August is unknown, but the odds of a repeat seem low.
First, though, a look back at last month’s numbers from the national weather service.
On Vancouver Island, both Victoria and Comox were warmer and wetter than normal.
Victoria’s average temperature for July was 17.3 degrees Celsius, up 0.4 degrees from its normal average of 16.9 C. The provincial capital also received 165.1 per cent of its normal rainfall for the month.
In Comox, the mid-island community had an average temperature of 18.5 C, up 0.5 degrees from its normal of 18 C. Regarding precipitation, Comox received 179.8 per cent of its normal rainfall.
WATCH BELOW: Farming and eating need to change to curb global warming: U.N. report

Vancouver was also hotter by half a degree (18.5 C, up from 18 C) but received only 86.6 per cent of its normal rainfall, resulting in a “normal” precipitation level.
In the Okanagan, it was a mixed bag. Kelowna was warmer than normal but had normal rainfall levels. Vernon had normal temperatures but was wetter than normal, while Penticton was normal in both categories.
In central B.C., Williams Lake and Prince George were both colder and wetter than normal, while in the northern part of the province, Fort Nelson had normal temperatures, but was wetter than normal.
For August, Environment Canada’s forecast probability says there’s a good likelihood the month will be warmer than average.

Get breaking National news
WATCH BELOW (Aired July 31, 2019): Halifax surfers’ claim of shark encounter sparks climate change conversation

That outlook was also predicted by the BC Wildfire Service (BCWS) in its seasonal outlook, which was issued Aug. 1.
“Fuel conditions are near normal throughout most of the province, due to precipitation received during the latter half of June and in July,” BC Wildfire Service said in its outlook.
“Many weather stations recorded data that indicated July was wetter than normal. However, drought levels in the western half of the province are still dry to very dry.”
WATCH BELOW (Aired July 4, 2019): Scientists say top Canadian climate risks are buildings, coastlines, the north

For September to October, BCWS is projecting “to have a high probability of above-seasonal temperatures throughout most of the province, particularly the western half.”
“We’re looking at long-term trends and patterns over time,” said BCWS fire information officer Erika Berg. “But the severity of a fire season is highly dependent on local weather patterns, such as timing and amount of precipitation, the length of a dry period, thunderstorms, wind events.
“Those are what really can set a fire season in motion and make wildfires harder to respond to.”
Average temperatures for July 2019
(compared to normal monthly temperature)
- Vancouver: 18.5 C (up 0.5 C from 18.0 C)
- Victoria: 17.3 C (up 0.4 C from 16.9 C)
- Nanaimo: 18.2 C (up 0.1 from 18.1 C)
- Comox: 18.5 C (up 0.5 C from 18.0 C)
- Abbotsford: 18.5 C (up 0.4 C from 18.1 C)
- Kamloops: 20.8 C (down 0.7 C from 21.5 C)
- Vernon: 19.7 C (up 0.6 C from 19.1 C)
- Penticton: 20.4 C (down 0.6 C from 21.0 C)
- Kelowna: 20.5 C (up 1.0 C from 19.5 C)
- Cranbrook: 17.3 C (down 1.4 C from 18.7 C)
- Williams Lake: 15.0 C (down 1.0 C from 16.0 C)
- Quesnel: 16.8 C (no change from 16.8 C)
- Prince George: 15.3 C (down 0.5 C from 15.8 C)
- Terrace: 17.5 C (up 1.0 C from 16.5 C)
- Smithers: 15.6 C (up 0.4 C from 15.2 C)
- Fort St. John: 15.8 C (down 0.4 C from 16.2 C)
- Fort Nelson: 16.7 C (down 0.4 C from 17.1 C)
Average rainfall for July 2019
(compared to normal monthly rainfall)
- Vancouver: 30.8 mm (86.6 per cent of 35.6 mm)
- Victoria: 29.5 mm (165.1 per cent of 17.9 mm)
- Nanaimo: 24.3 mm (95.6 per cent of 25.4 mm)
- Comox: 48.0 mm (179.8 per cent of 26.7 mm)
- Abbotsford: 50.2 mm (116.1 per cent of 43.2 mm)
- Kamloops: 36.0 mm (114.6 per cent of 31.4 mm)
- Vernon: 52.5 mm (115.1 per cent of 45.6 mm)
- Penticton: 24.4 mm (85.0 per cent of 28.7 mm)
- Kelowna: 42.4 mm (113.9 per cent of 37.2 mm)
- Cranbrook: 50.4 mm (131.5 per cent of 38.3 mm)
- Williams Lake: 91.8 mm (174.2 per cent of 52.7 mm)
- Quesnel: 88.8 mm (135.4 per cent of 65.6 mm)
- Prince George: 85.2 mm (137.2 per cent of 62.1 mm)
- Terrace: 75.3 mm (142.7 per cent of 52.8 mm)
- Smithers: 53.3 mm (117.0 per cent of 45.6 mm)
- Fort St. John: 64.9 mm (86.3 per cent of 75.2 mm)
- Fort Nelson: 118.8 mm (151.6 per cent of 78.4 mm)


Comments