
You decide. Todd Hirsch, Chief Economist for ATB Financial, recently posted a blog in his organization’s The Owl in which he argues that are down in 2013 possibly because the railways are challenged to handle record volumes of oil and bitumen traffic.

His theory is that the railways are not able to transport the empty grain cars back from the ports to grain elevators because of the increased volume of crude and bitumen shipments. The only evidence he gives is that there were record crops in 2013 but deliveries for 2013 were down compared to 2012 he supports this with a CANSIM graph on Delivery of Grains and Oilseeds that is reproduced here.

So let’s consider Hirsch’s argument. First, he is right in that there was a record crop in 2013 but did the railways fail to transport it because of increased traffic from crude oil?
One way to test this out is in the number of cars that railways move each month and what are they filled with. Are there more cars being filled each month with oil AND is there a corresponding drop in the amount of cars filled with grains and cereals?
Happil,y Statistics Canada keeps track of these numbers. They are called carloadings (CANSIM 404-0002). They are tracked on a monthly basis and cover all commodities moved by railways since 1989. This is reported within two months of current with November 2013 being the last reported month.

We are particularly interested in is the comparison of grains loaded onto railway cars against loadings for fuel oils and crude petroleum (StatsCan doesn’t distinguish between the two). According to Hirsch’s theory we should see a decline in the shipping of grains as crude shipments increase. Or to put it another way, the percentage of carloads of grains should be dropping while the percentage that railways load of crude oils and petroleum should be increasing.
The monthly graph does show an increase in crude oil loadings in the last couple of years. In fact, fuel oils and crude petroleum have nearly doubled in the last two years from 3.0 per cent to 5.3 per cent of total commodities loaded. However, there is no corresponding drop in grains. In fact grains accounted for 9.2 per cent of all commodity car loadings in January of 2012 and in November of 2013 they increased to 10.7 per cent. This is in agreement with the November 2013 Statistics Canada report which indicated increases in carloads for iron ores, coal, crudes AND wheat.
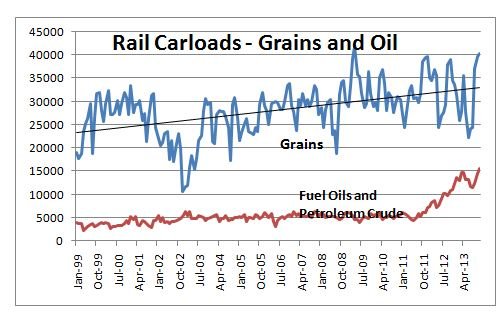


And the next graph from Statistics Canada data gives an even clearer picture of the long-term trends. Grain carloads are increasing since 1999. Crude oil carloads from 1999 to 2011 remained flat lined and have only started to show an increase in the last two years. But notice that grain carloads have not dropped off but continue to increase in the last two years. So the data does not seem to support Hirsch’s theory. Again, the long-term trend for the grain loadings is actually an increase – not as steep as oil but still an increase (again the Statistics Canada report agrees).
What is more instructive to understanding the real issues at play is the high volatility in grain loadings over the years?It is clear that this volatility in grain deliveries cannot be explained by an increase in crude oil shipments. So what better accounts for this? In other words, what is a more accurate understanding of what we are seeing?
- Trudeau says ‘good luck’ to Saskatchewan premier in carbon price spat
- Canadians more likely to eat food past best-before date. What are the risks?
- Hundreds mourn 16-year-old Halifax homicide victim: ‘The youth are feeling it’
- Vacation death: Cuba apologizes after Canadian family receives wrong remains
In grains, variations reflect that crops are harvested in the fall and farmers are seeking delivery to increase cash flows, pay for immediate expenses, and fulfill forward contracts that came due. Then, for some, there is a holding back the rest of their crops to sell when they feel they can get a higher price later in the year in the free market place.You see this pattern repeated with different variations in the historical data. Other explanations for this year’s dramatic drop in deliveries is the bumper crops in all varieties of grains and cereals and the return in the US to a more normal harvest compared to the drought-stricken 2012, in other words, soft market demand.Grain delivery numbers actually describe a system with several potential bottlenecks or chokepoints. Grain elevators, number of rail cars (remember railways for the most part don’t own the cars just the engines), railway utilization, weather (number of days over -250C is way up this year – this is impacting all railways to move commodities), coastal grain terminals (some won’t load grain when it’s raining), ship availability and market demand are all part of that system. Any of these or in combinations can be chokepoints.
So you decide. Does the economic evidence support a suggestion that might pit farmers against railways (again – sigh)?
Comments