
Yesterday the Fraser Institute released its ranking of secondary schools in British Columbia. It’s an annual event that tends to inflame opinions as much as inform them, with many people criticizing the list as being overly simplistic or being biased in favour of private schools.

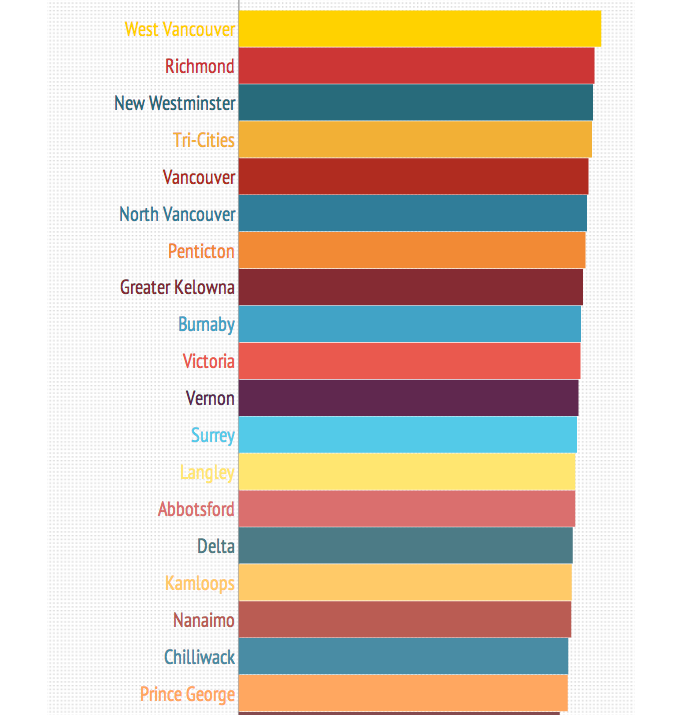
But there’s also a large amount of interesting data within the rankings. Using that information, Global BC has created an interactive chart of average provincial exam marks in public schools across the province.

Get breaking National news
Get breaking Canada news delivered to your inbox as it happens so you won't miss a trending story.
By providing your email address, you have read and agree to Global News' Terms and Conditions and Privacy Policy.
We’ve also created an infographic to show some of the problems in directly comparing public and private schools.
Comments
Want to discuss? Please read our Commenting Policy first.