

Canada’s lowest-income households are also shouldering the heaviest burdens when it comes to debt, a new study from Statistics Canada confirms, owing a staggering $3.33 for every dollar they bring home.

Overall, the amount that Canadians across the country owe relative to their income was already high in 2016, at $1.72 in debt (defined as all credit market debt plus trade credit) for every dollar of disposable income, on average.
But when you break the numbers for 2016 down by income groups, a troubling pattern emerges and it reveals who, exactly, is carrying the bulk of the debt load.
READ MORE: Canadians now owe $1.71 for every $1 they make on average
Statistics Canada divided up Canadian households into five groups, ranging from the people with most disposable income, to those with the least. Disposable income is firmly concentrated among the rich in Canada, the agency noted, with the top 20 per cent of income-earning households accounting for 41 per cent of total household disposable income.
At the bottom of the pile, among the households with the least amount of money to spend, people owed $3.33 in debt for every dollar available. On the opposite end of the spectrum, among the households with the most disposable income, the number was $1.28 per dollar available.


While Thursday’s news is certainly not good for low-income Canadians, Statistics Canada pointed out that the country’s richest are also seeing their debt loads increase.

Get weekly money news
“From 2012 to 2016, the ratio has increased significantly for the higher income quintiles, who have seen debt increase faster than income over this period,” the agency noted.
How much do you own, and how much does the bank own?
Statistics Canada also took a look at another measure of financial health: the household debt-to-asset ratio.
Simply put, that number represents the percentage of a household’s total assets that were paid for with borrowed money.
The agency says this number helps demonstrate “the degree of leverage a household has in relation to its debt. The greater the debt leverage, the more susceptible a household may be to financial vulnerabilities in the future.”


READ MORE: How much does a week of groceries cost in Canada? We crunched the numbers
Again, lower-income households were hardest hit. The national average debt-to-asset ratio in 2016 sat at 16.6 per cent, but it shot up to 29 per cent for incomes on the bottom rung. Meanwhile, the top fifth of income earners had a ratio of 11.1 per cent, and people in the middle of the pack registered 21.3 per cent.
The differences were much more stark by age group, however, as younger Canadian households had a much higher debt-to-asset ratio than older households.
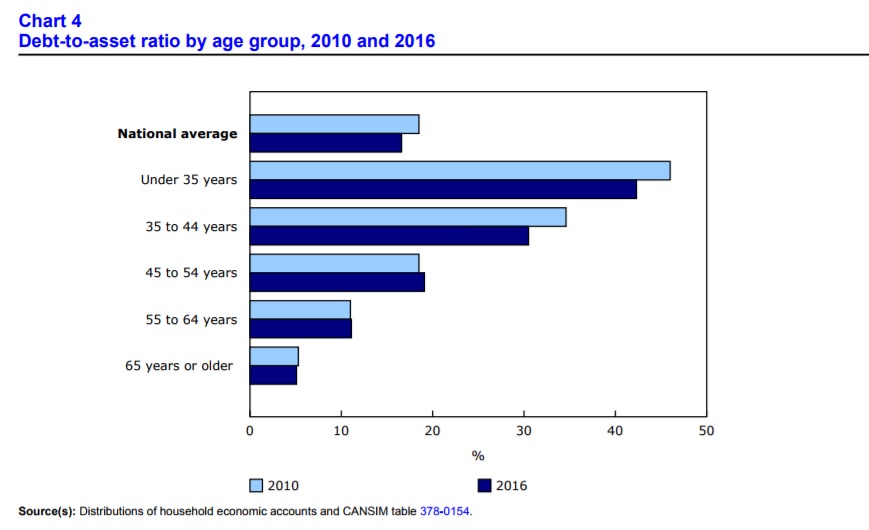
“In 2016, the debt-to-asset ratio was 42.3 per cent for households with a major income earner aged under the age of 35, while the 65 years of age or older group had a debt-to-asset ratio of 5.1 per cent,” Statistics Canada noted.
That’s consistent with how households usually accumulate wealth and pay down their debts over time. Equity in a home, for instance, grows over the decades as people pay off their mortgages.
There were also geographic patterns, however. Over the last several years, for example, households in Alberta have had the highest debt-to-asset ratio of any province in Canada. In 2016, the debt-to-asset ratio in that province was 20.4 per cent.
Comments
Want to discuss? Please read our Commenting Policy first.