
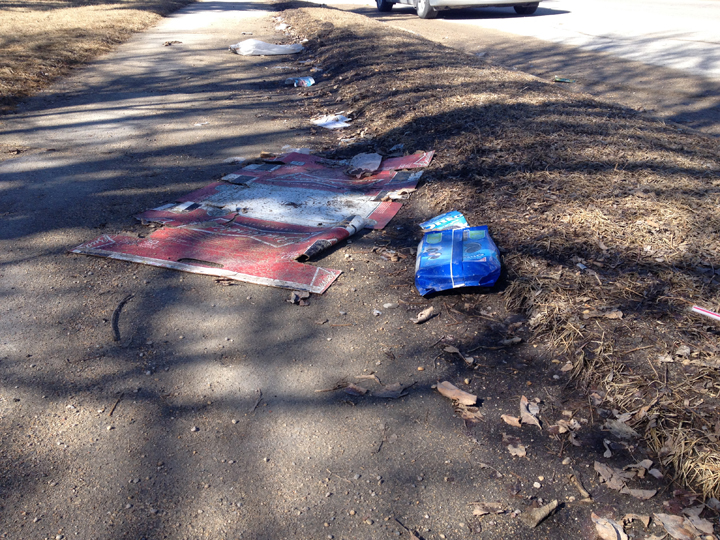
WINNIPEG — As the snow continues to melt, it’s starting to reveal sidewalks, boulevards and streets covered in winter litter.

But some areas are worse than other and Take Pride Winnipeg hit the streets looking for the city’s dirtiest neighbourhood.
For a second year in a row, northwest Winnipeg has won the the title.
The Take Pride Winnipeg 2016 Litter Index ranks the state of the city’s neighbourhood cleanliness based on a scale of 1-4, with the dirtier neighbourhoods getting the higher scores.
Northwest Winnipeg earned a score of 2.85, and the cleanest neighbourhood was the Winnipeg south area, with an average score of 2.41.
RELATED: Spring melt leaves needles, garbage and sand piling up on Winnipeg streets
The average score for Winnipeg was 2.33 in April (last year the city scored 2.32).
“Spring is here and now we see the results of litterbugs throughout the winter. We also ask all Winnnipeggers to do their part in cleaning our streets and parks,” Tom Ethans with Take Pride Winnipeg said in a media release.
Full results
Area 1: Northwest average score: 2.67
Worst Streets: Oak Point Highway to Perimeter Highway; Perimeter Highway from Oak Point Highway to McPhillips Street; Kinver Avenue between
Keewatin Street and Garden Grove Drive; and Redwood Avenue between Keewatin Street and Sheppard Street.
Area 2: North/Central average score: 2.85
Worst Streets: Inkster Boulevard from Main Street to Salter Street; Burrows Avenue between Main Street and Arlington Street; and Dufferin Avenue between Salter Street and Main Street.
Area 3: Northeast average score: 2.52
Worst Streets: Chief Peguis Trail west of Henderson Highway; Sutton Avenue; Raleigh Street; and Panet Road.
Area 4: Transcona average score: 1.95
Worst Streets: Reenders Drive.
Area 5: West average score: 2.08
Worst Streets: Century Street between Portage Avenue and Dublin Avenue; and Sturgeon Road.
Area 6: West End average score: 2.31
Worst Streets: Sherbrook Street from Portage Avenue to Cumberland Avenue; Cumberland Avenue from Sherbrook Street to Colony Street; and Omand’s Creek.

Area 7: Downtown average score: 1.96
Worst Streets: Colony Street from St. Mary Avenue to Broadway; Bannatyne Avenue from Sherbrook Street to Princess Street; and McDermot Avenue from Sherbrook Street to Princess Street.
Area 8: St. Boniface average score: 2.37
Worst Streets: Dugald Road from Lagimodiere Boulevard to Dawson Roadl; and Fermor Avenue from St. Mary’s Road to Westmount Drive.
Area 9: St. Vital/South Osborne average score: 2.30
Worst Streets: Perimeter Highway between St. Anne’s Road and St. Mary’s Road; St. Anne’s Road from Perimeter Highway to Bishop Grandin Boulevard; and Meadowood Drive from St. Anne’s Road to Ashworth Street.
Area 10: Southwest average score: 2.06
Worst Streets: Perimeter Highway from Wilkes Avenue to Roblin Boulevard; and Wilkes Avenue from Shaftesbury Boulevard to Perimeter Highway.
Area 11: Fort Rouge/ Fort Garry average score: 2.51
Worst Streets: Confusion Corner; Stradbrook Street/River Avenue from Main Street to Donald Street; and Waverley Street from Taylor Avenue to Wilkes Avenue.
Area 12: South average score: 2.41
Worst Streets: Kenaston Boulevard from Perimeter Highway to Bishop Grandin Boulevard; McGillivray Boulevard from Pembina Highway to Waverley Street; and Perimeter Highay from Pembina Highway to Kenaston Boulevard.
Comments