
We all know the world is grappling with a global obesity epidemic. But what does the crisis look like when it’s visualized on a world map?

Using decades-long data on obesity rates from around the world, a U.S. entrepreneur and data specialist showed just how quickly rates of obesity climbed in every corner of the globe. The growing trend of weight gain is touching every part of the world.
“I was amazed by how the trend is the same around the world, across the entire time frame and in every single country,” Max Galka told Global News.
Galka is a New York City-based data visualization specialist and founder of an upcoming mapping platform called Blueshift. He also teaches data visualization at the University of Pennsylvania.
“I’m not an expert in obesity but in my personal view, a lot of people see the problem of obesity as being a choice, that people just eat too much. But this map says to that there’s something more systemic going on here. When you see this kind of trend so pronounced over such a long period and over such diverse areas, it can’t be just that,” he said.
READ MORE: How this Danish doctor is battling childhood obesity around the world
Over the past four decades, obesity rates “ballooned” around the world, Galka wrote on his website. The average adult today is three times as likely to be obese compared to the average adult back in 1975, he said.
Here’s a look at the map he built: the colour of each country represents its adult obesity rate in the year shown.
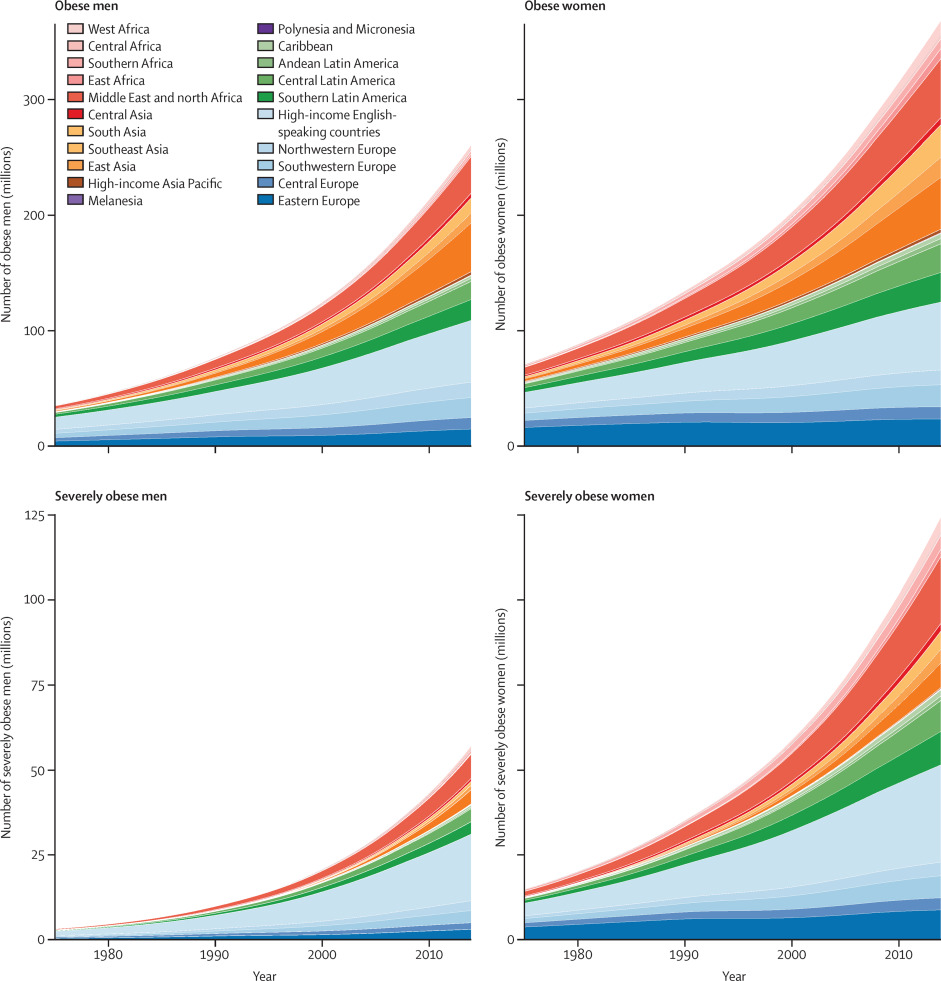
Galka retrieved the statistics from a comprehensive study published in The Lancet in 2016. The health data of about 19.2 million people from 186 countries from 1975 to 2014 was considered in the study.
READ MORE: What one woman in Gabon taught doctors about global obesity
Right now, about 2.3 per cent of the world’s men and five per cent of the world’s women are considered obese, based on the study’s findings. In 1975, the numbers were just a fraction of one per cent for both genders.


“Without exception obesity rates have risen in every country around the world,” Galka wrote.
READ MORE: Childhood obesity rates fall in Canada for the first time in years
What stood out to Galka most was China. In 1975, only 0.5 per cent of Chinese adults were obese, but by 2014, rates climbed to eight per cent – that’s more than 100 million people living with obesity.
In Canada, obesity rates were at 9.1 per cent in 1975. Today, they’re at 27.7 per cent.
Health officials have tied obesity and excess weight to a string of chronic diseases, such as diabetes, heart disease and high blood pressure.
Galka hopes his map is an easier way to understand a global health crisis that needs to be addressed.
READ MORE: Obesity rates have tripled in Canada in less than 3 decades
“As the digital universe continues to grow, making sense of all that information presents an increasingly difficult challenge. Fortunately, it may have an easy solution: communicate it visually,” he wrote in a Guardian post about his work.
carmen.chai@globalnews.ca
Follow @Carmen_Chai
Comments