

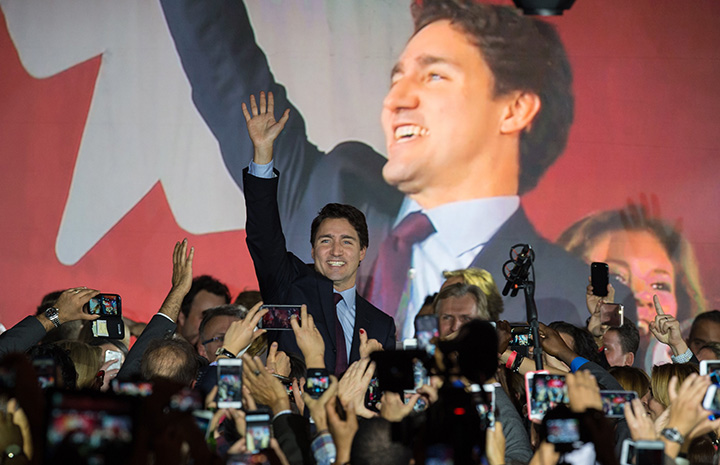
The swath of red ridings that propelled Justin Trudeau to a thunderous Liberal victory Monday boasts more newcomers as a percentage of the population than any other party’s territory.

That’s a stark contrast to 2011, when many of Canada’s fastest-growing, diverse metropoles, especially in the urban and suburban areas around Toronto and Vancouver, voted Conservative.
And pre-election polls indicated that support stayed steady despite some critics’ unease at the Tories’ focus on the niqab and so-called “barbaric cultural practices.”
Liberal-won races were tighter than Tory victories but boasted wider margins than the NDP or Bloc.
And red ridings are somewhat younger and slightly lower-income than the Canadian average; but not by much.
READ MORE: What Trudeau promised and what he’ll face as PM
It’s early days and everyone’s still slogging through electoral hangovers. But Global News took the riding-level data we had at hand to get a sense of who the 7 million Canadians are who voted Trudeau 2.0 into 24 Sussex Dr.
The data below is based on results from Elections Canada and riding-level statistics from Statistics Canada, primarily from the 2011 census. (Some of it is from the National Household Survey, whose unreliability we’ve documented. We’re sorry we have to use this but we felt its inclusion enriched our journalism more than the faulty data skewed it.)
We couldn’t get turnout for each of 338 ridings because, much to our chagrin, Elections Canada won’t put it in a spreadsheet: You have to download each riding’s turnout individually. We’ll post that when we have it.
And of course we don’t know how individuals voted — only ridings and their population. So we’re extrapolating, here.
Explore each riding by margin of victory, median age and income and percentage of new Canadians here.
A nation of immigrants
Residents of the 184 Liberal ridings are more likely to be new Canadians — about one in four were born outside Canada. (The Canadian average is about 20 per cent)
Of the 10 Canadian ridings with the highest percentage of immigrants, eight went Liberal.
Two, Richmond Centre and Markham-Unionville, stayed Conservative. Each of these ridings had comparatively few recent immigrants compared to the other eight.
Of the 30 Canadian ridings whose populations are more than 50 per cent immigrants, all but four voted Liberal.
Of those four, Burnaby South and Vancouver Kingsway went NDP; Richmond Centre and Thornhill went Tory.

Compare this with 2011, when the Liberals only won three of the top 10 ridings, and seven of the 29 ridings where immigrants make up more than 50 per cent of the population:
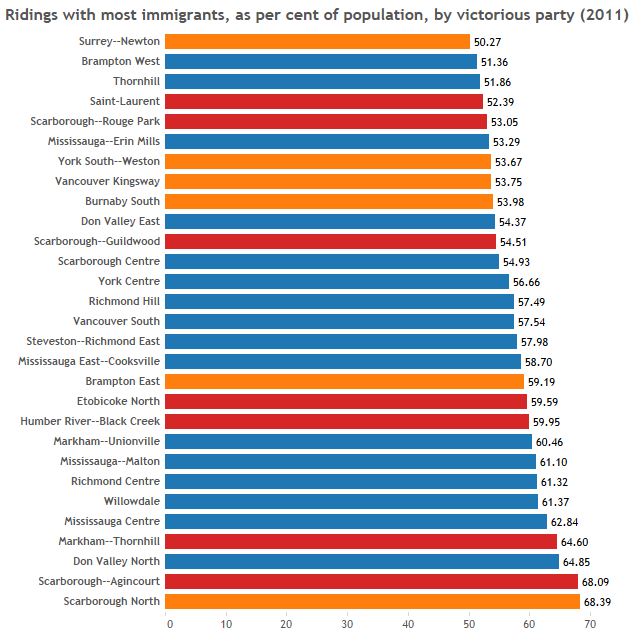
These figures are for all immigrants, regardless of when they came to Canada.
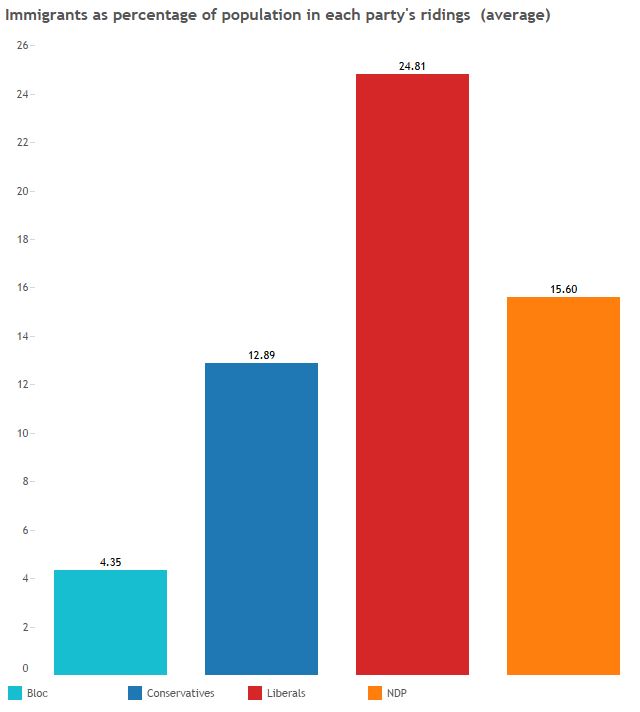
But the stats for recent immigrants — people who came after 2006 — follow the same pattern: On average, about one per cent of residents in ridings the Bloc won are recent immigrants; that goes for two per cent of Conservative ridings, 2.8 per cent of NDP ridings and 4.4 per cent of Liberal ridings.
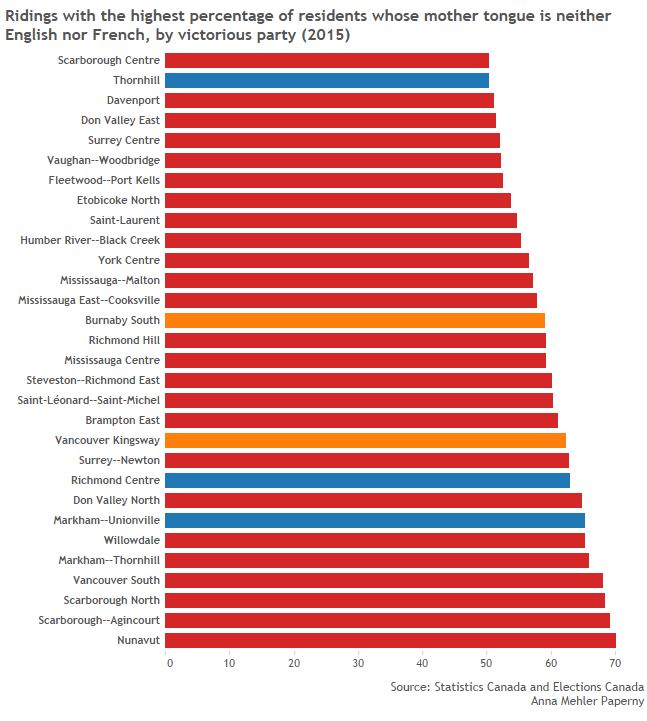
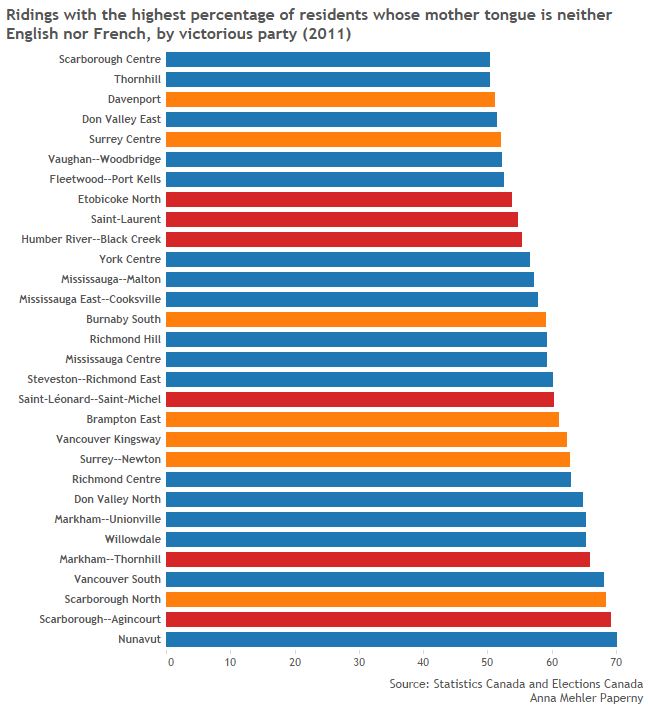
We saw a similar pattern for Canada’s most linguistically diverse ridings — the ones with the most people whose first language is neither English nor French.
Here’s how the votes shook out in Canada’s 31 ridings where more than half the population has a non-official mother tongue:
And here’s how those ridings voted four years ago:
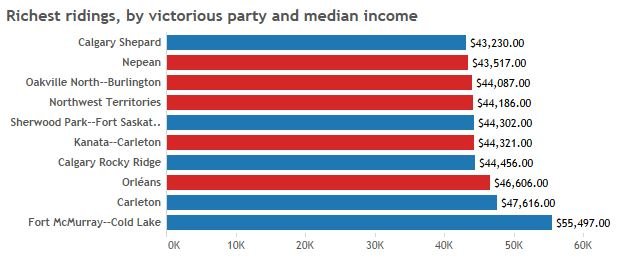
Income outcomes
Of the 10 Canadian ridings with the highest median income, five voted Conservative and five Liberal. None of them voted Liberal in 2011.
Of the 10 ridings with the lowest median income, the two lowest — Manitoba’s Churchill–Keewatinook Aski and Desnethé–Missinippi–Churchill River — went NDP. The rest, including Trudeau’s riding of Papineau, whose 2011 median income was about $20,118, went Liberal.
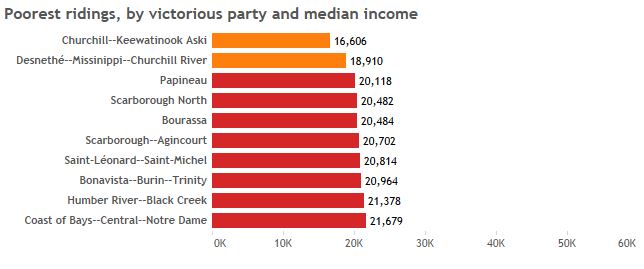


Eleven of the 52 ridings with median incomes below $25,000 went NDP and 36 Liberal.
Family matters
Families with children like Trudeau.
A particularly strong indicator of Liberal support, says University of Calgary economist Trevor Tombe, is the share of families with kids per riding: The more of them there are, the more likely the riding was to go Liberal this election.
“The Liberals did play up pretty strongly their changes to the child benefits,” Tombe told Global News. “So I’d say that was a fairly successful strategy on their part.”
Families with kids were also more likely to vote Liberal in 2011, as well, Tombe notes. But the trend is much stronger this time around.
Age issues
Of the 10 youngest ridings (the ones with the lowest median age) six went Liberal on Monday, two went NDP and two Conservative. And just over half the Liberals’ ridings have residents whose median age is below Canada’s national median, 40.5
Of the 10 oldest ridings, three went NDP, one went Green, three went Liberal and three went Conservative.
Nail-biter races
The election itself was a landslide but many individual races were razor-thin: A dozen had margins of victory below one per cent; 28 ridings below two per cent.
The tightest were in Winnipeg; Barrie, Ont.; northern Saskatchewan; Edmonton and Regina.

Five of the 10 closest races were in formerly Conservative ridings that went either Liberal or NDP; the 10 biggest landslides were split between Liberals and Conservatives.
But for the most part the Tories boasted the widest margins of victory — 22 per cent, on average. The Bloc’s races were tightest (although admittedly there were far fewer of them) with an average margin of about 7 per cent.

INTERACTIVE: Explore riding results in the table below. Enter text in the search box, scroll or click the headers to sort ascending or descending.
Comments