
WATCH: As the amount of bicycle traffic increases in Vancouver, so does the tension between bikes and cars. John Daly has the story.

A presentation was made to Vancouver council this week on the transportation habits of people living in the city.
Using data obtained through trip diaries of 2,500 Vancouverites, ICBC figures, and counters on bike lanes, the report painted a picture of a city where cycling, walking and public transportation are increasingly the norm for many citizens.
Here are five charts that outline the numbers.
1. Half of trips are made by transit, walking, or cycling
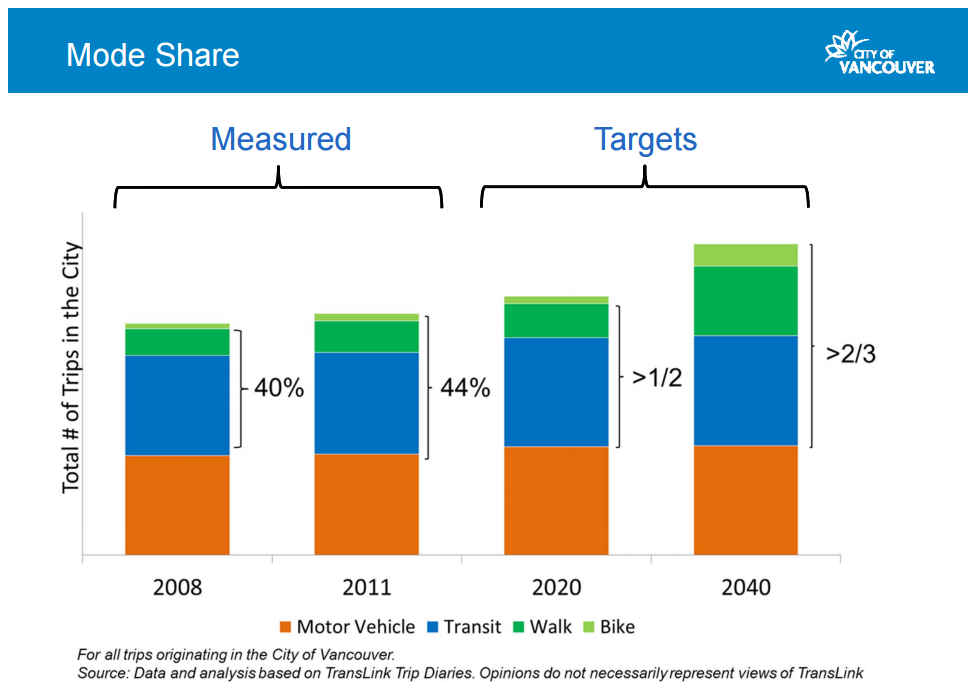
The city says that 50 per cent of all trips by people in Vancouver are now made by a form other than a motor vehicle, compared to 44 per cent in 2011.
Technically, driving still leads, with an estimated 918,000 trips in 2014 compared to 905,000 on transit, bicycle and foot.
It also means the city has eclipsed its target under the Greenest City Action Plan.
2. The decrease in car use has come while cycling has increased
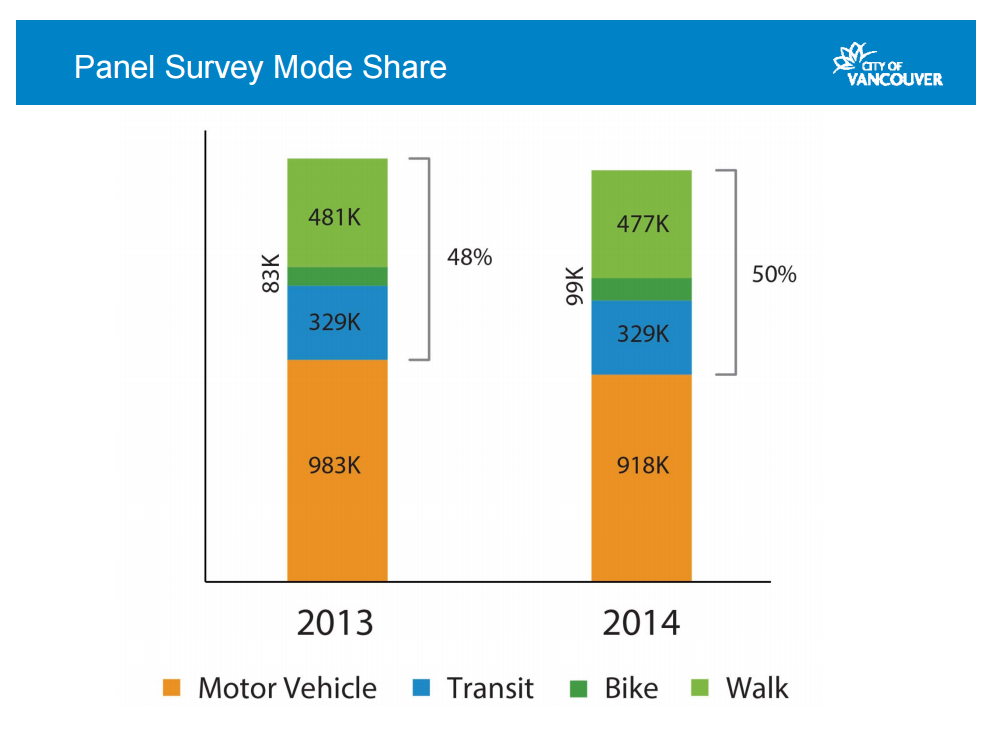
The city’s panelists didn’t just reduce their car usage, from 983,000 trips in 2013 to 918,000 in 2014: they also increased their bicycling. Total cycling went up from 83,000 in 2013 to 99,000 in 2014.
3. Transit use within Vancouver has seemingly plateaued
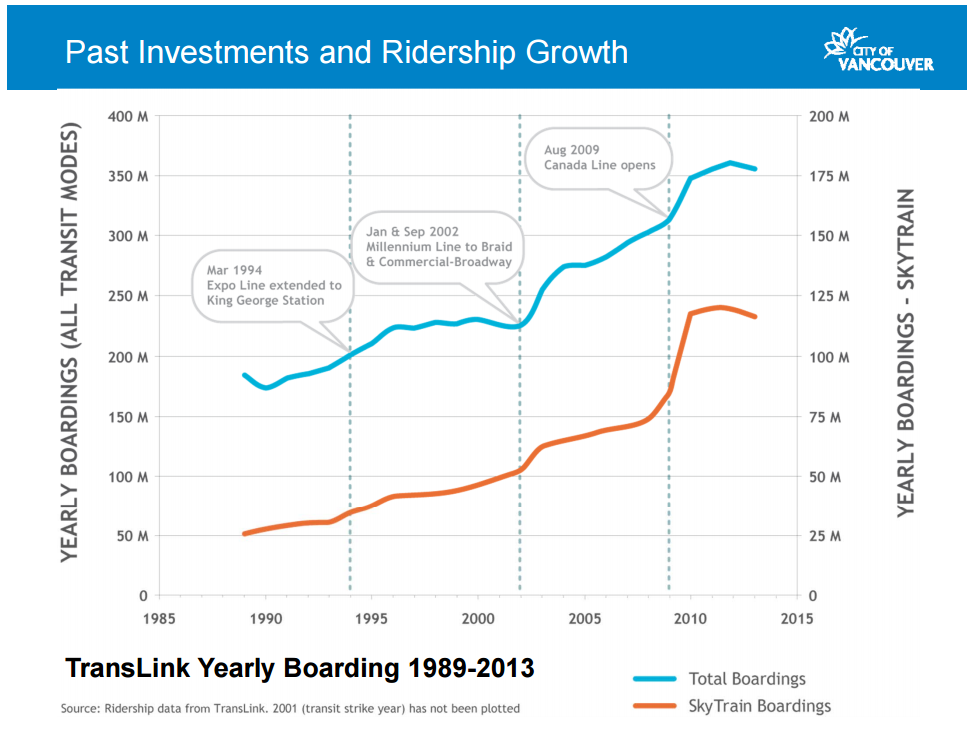
As the two previous graphs show, transit use within the city didn’t grow between 2013 and 2014 – and according to statistics from TransLink, it’s stayed about the same for 2010. While numbers for 2014 aren’t included in the graph, TransLink said late last year ridership was down for the entire region.

4. Cyclists seem to be rarely at fault in collisions
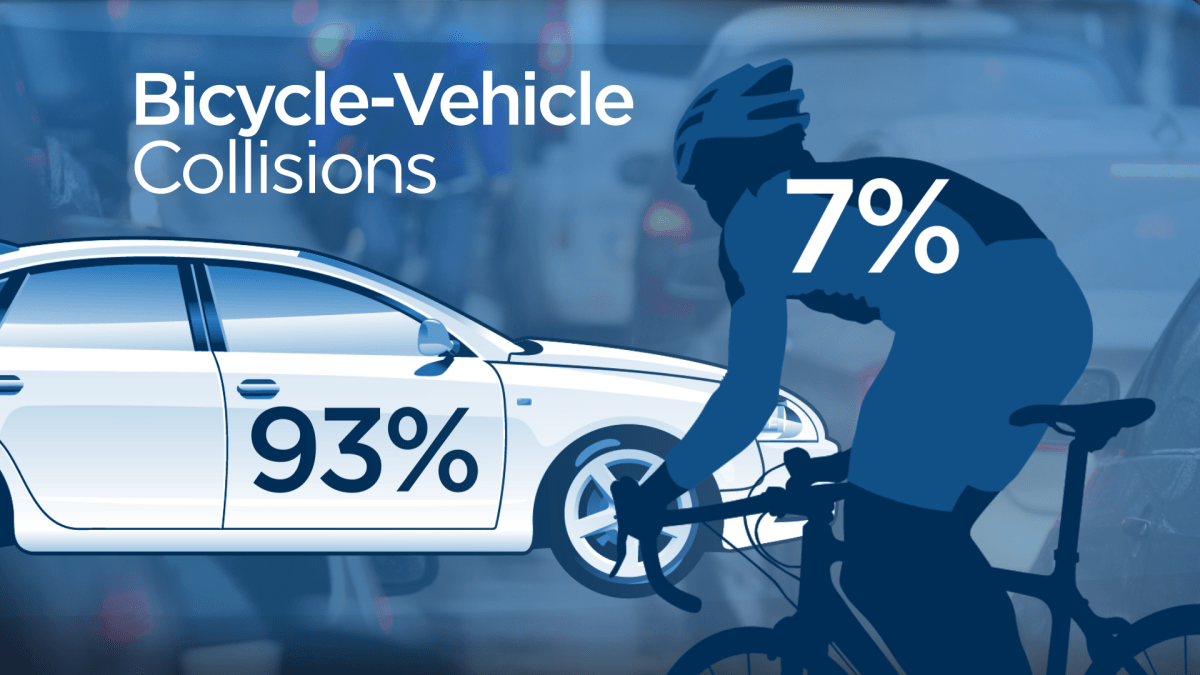
Even though right of way could only be determined in 54 per cent of collisions with cars, ICBC data indicates cyclists had the right of way 93 per cent of the time.
5. Cycling is up, but helmet infractions are down
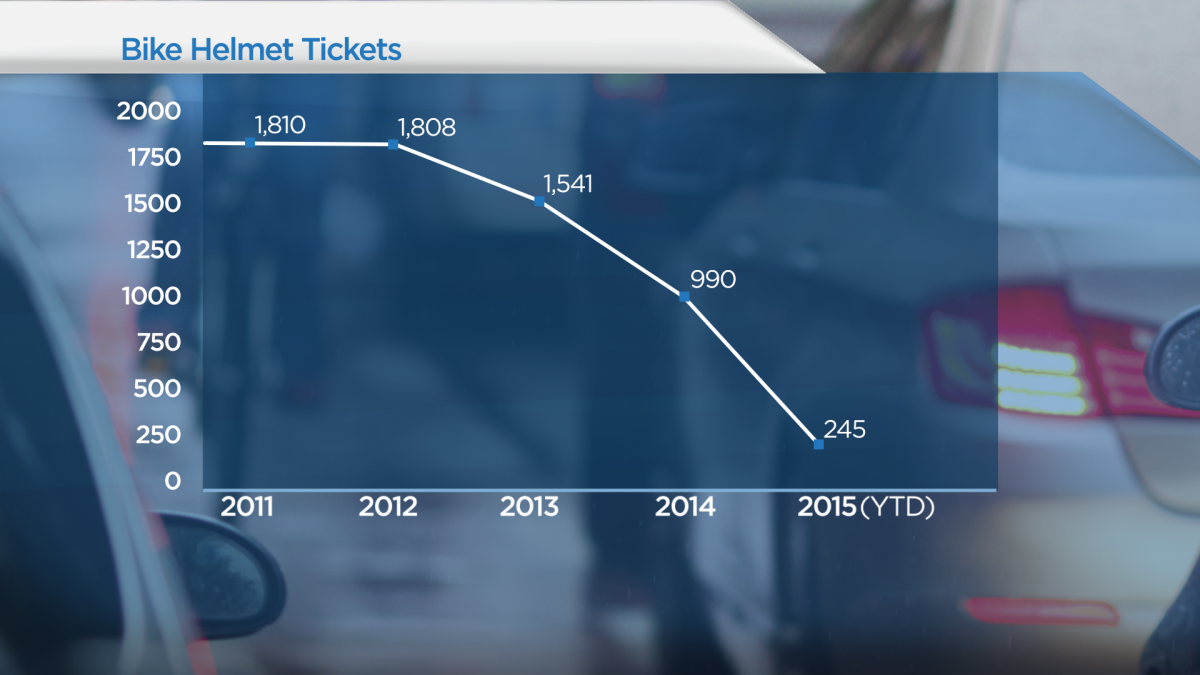
Cycling trips were up 19.3 per cent in 2014 compared to the year before, according to the report, and cycling volumes at the city’s nine permanent counter locations were up 11 per cent. However, tickets for not wearing a helmet were reduced almost in half from 2011 to 2014, and look to be sharply down again this year.
And for those that do have helmet tickets deemed guilty, the vast majority remain unpaid. Of the 913 tickets in 2014, just 79 had been paid at the time of the report.
Comments