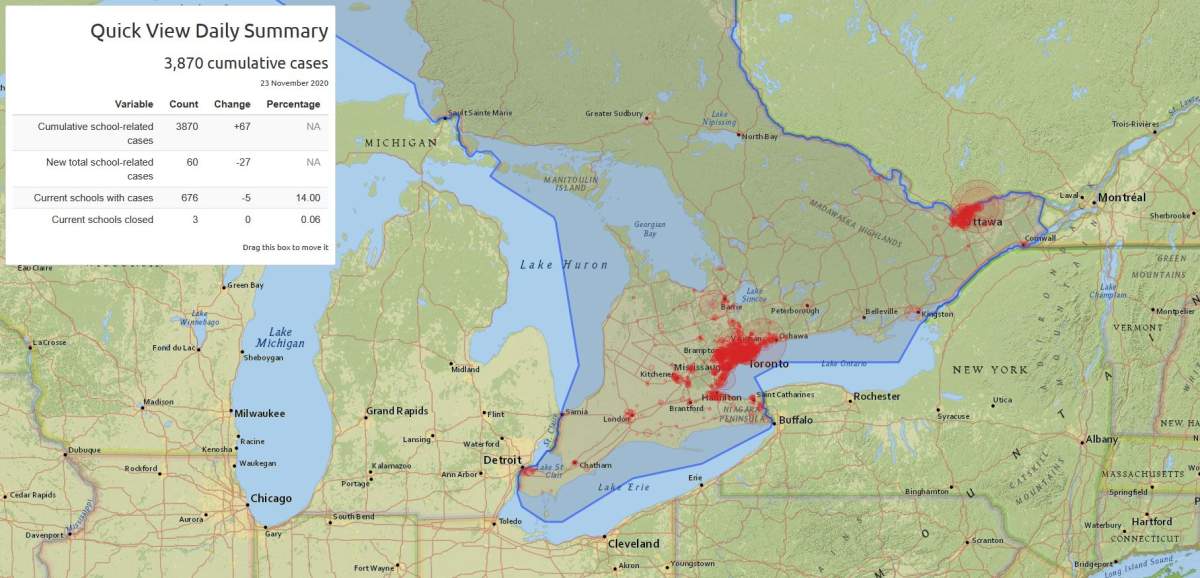
An expert in global education based in London, Ont., has launched a new interactive map of confirmed school-related cases of COVID-19.

Western University education professor Prachi Srivastava says the map allows for real-time data in a visualized form and connects it to school-level social background characteristics and demographic data to help increase transparency and understanding among the school community and broader public.
“The effects of COVID-19 are more severe on high-risk communities, populations, and schools and there are strong equity concerns,” Srivastava said in launching the COVID-19 School Dashboard.
“Visualizing COVID-19 case data with data on school social background characteristics will give us a better understanding of the composition of affected schools.
“In short, we will get closer to understanding the human dimension of COVID-19 on school populations.”
Hovering over a bubble shows how many cases there are, as well as information about the proportion of students from low-income households, whose first language is not English, whose first language is not French, who are immigrants from a non-English-speaking country, who are immigrants from a non-French-speaking country, or whose parents have some university education. The size of the bubble itself indicates “the magnitude of cumulative cases” when compared to other schools.

Currently, the school with the largest number of confirmed coronavirus cases in the province is Frank W. Begley Public School in Windsor, Ont., with 38 confirmed cases as of Nov. 24.

Get weekly health news
According to Srivastava’s map, the proportion of Begley students from low-income households is 72 per cent, while English is not the first language for 56 per cent and French is not the first language of 100 per cent.
The schools with the second-largest number of confirmed COVID-19 cases in Ontario, as of Nov. 24, are École élémentaire catholique des Pionniers in Ottawa and Pickering High School in Ajax with 19 cases each. Both schools have 10 per cent of students from low-income households.
English is not the first language for 13 per cent of students and French is not the first language for 100 per cent of students at Pickering High School. At des Pionniers, the first language is not English for 80 per cent of students and is not French for 20 per cent of students.

Western stresses that the site “should not be used to draw inferences on the broader COVID-19 situation in Ontario or on case numbers generally.” However, over time, the map will allow for a clearer picture of “which schools and which school populations are most affected.”
The dashboard uses data from the Ministry of Education and so there could be “lags and ‘missing cases'” depending on what and when the ministry reports.
The map provides users with a comprehensive minimum figure of school-related cases and where they are located, and crucially — over time as the situation evolves — Srivastava says we will get to see which schools and which school populations are most affected.
A spokesperson with the Ministry of Education says that information is shared through open data “to allow academics and others to build tools that layer socio-economic and other factors on top of school cases data.”
“Thanks to our strong health and safety protocols informed by leading medical experts, our schools have been successful at minimizing outbreaks despite increased rates of community transmission,” the spokesperson added.
“Any increase in numbers is a reminder that we need to stay vigilant in following public health guidance and we must not let our guard down.”
Srivastava’s map is updated automatically every weekday except on public holidays.
“My hope is this site may prompt other jurisdictions to post similar data in Canada and globally, or prompt the public to ask that they do,” she said.
Srivastava’s work focuses on international development and equity in schools and Western says she recently “led a high-level policy brief for the T20 Task Force on the pandemic, which informed G20 world leaders.”


Comments