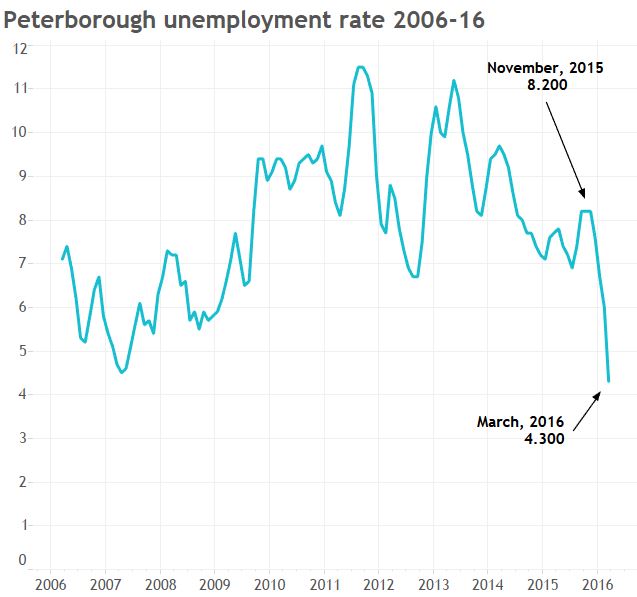
Either Peterborough had a truly incredible March, or something’s wrong with the way Canada tracks unemployment.
The Ontario city’s unemployment rate, according to numbers released Friday, dropped 90 per cent between November and March — 40 per cent between February and March alone. That’d be a truly impressive feat, especially given Ontario’s swooning manufacturing numbers the same month.
But is it true?
“No,” says Stuart Harrison, CEO of Peterborough’s Chamber of Commerce.
“It just makes you question the reality. And without completely dismissing the numbers, we certainly minimize their importance.”
Harrison gets asked about Peterborough’s weird unemployment numbers all the time.
“We’re always being asked to explain. And I don’t think that it’s explainable,” he said.
“Next month it could be 8 per cent. We’ve gotten used to it.”
Statistics Canada’s monthly Labour Force Survey tracks employment, unemployment and several other facets of Canada’s labour force broken down by region, gender and multiple demographic factors.
The number everyone focuses on is the unemployment rate — the percentage of people in the workforce who say they’re out of a job.
But the survey and its info are also used as a snapshot of how Canadians work, which Canadians work and how that varies across the country.
That’s a problem. Because the Labour Force Survey can be kind of a mess.
March was particularly noisy: Multiple cities’ unemployment rates dropped or rose of at least a full percentage point within the month.
“It’s not just Peterborough,” said Mike Moffatt, an economist at the Ivey School of Business and Toronto’s Mowat Centre.
“Windsor’s seeing the same thing. … Alberta gained a pile of jobs this month, almost all in retailing and wholesaling.”
Why are the stats especially skewed this month?
“They do the survey in the middle of the month; maybe everybody was out celebrating St. Patrick’s Day or something.”
READ MORE: Alberta men have higher unemployment than Canadian average for first time since 1989
Part of the problem is shifting human behaviour: The Labour Force Survey relies on people voluntarily responding and telling strangers all about their work situation.
And when was the last time you answered a call from a number you didn’t know?
“People are less likely to take these surveys and answer the phone than they used to be,” Moffatt said.
“The survey rates have been falling. … If you call the wrong people, you’ll get these weird results.”
(Statistics Canada’s website says it gets no response from about 10 per cent of people it queries in the Labour Force Survey. We’ve asked them how that figure has changed over time and will publish it when we have it.)
The same problem’s plaguing political pollsters. You can weigh the responses you get to match the demographic profile you’re sampling, but you don’t know the answers you aren’t getting.
But survey data in Canada gets a double whammy — from behavioural changes and by a deeply flawed demographic model.
As Global News has documented, the results of the 2011 National Household Survey that replaced the long-form census are notoriously unreliable. And Canadians in some walks of life, in some parts of the country, were far less likely to fill out the survey than others.
NATIONAL HOUSEHOLD SURVEY: Here’s what we know about what we don’t know
WATCH: What’s missing from the National Household Survey
Peterborough’s non-response rate was among the highest in the country: Four in 10 of people in the city who got the survey didn’t bother to return it.
That data forms the standard against which virtually every serious demographic survey is based. So its unreliability is a problem.
“I’ve heard that concern from a lot of economists and a lot of statisticians. The NHS acts as the basis for everything,” Moffatt said.
“I think that’s of particular concern in mid-sized communities where you have a demographic group that doesn’t answer the survey at the same rate.”
One of the first things the Liberals did after being sworn into office federally was to pledge to bring back the long-form census — a tall order, given that it gets sent out this year. Statistics Canada has said it’s do-able.
DATA DEFICIT: How Canadians are coping sans long-form census
There’s no need for a nerdy existential crisis, Moffatt says: It just means taking a longer-term view and not treating the unemployment rate as gospel.
But it also means we should look to other sources of data — Employment Insurance claims, for instance.
Those are more reliable in that you get the exact number of claims filed (and refused, granted, etc). But there are huge disparities in EI coverage across Canada — you couldn’t use that data to compare between regions.
READ MORE: Alberta EI claims almost double in a year
Could Peterborough’s non-response to the National Household Survey be connected to its unreliable numbers in the Labour Force Survey?
“That certainly sounds like it, but I’d have to drill down a little bit more in order to speak with any authority,” Harrison said.
“I don’t know what has an effect or what doesn’t. I just know that I don’t really trust the numbers. I respect the numbers. And I understand they’ve got a job to do. And that’s fine: They’re informative. But it’s not like we’re going to suddenly stop everything because unemployment’s been solved.”