Canada and the U.S. share the largest and most comprehensive bilateral trade relationship on earth, according to the U.S. State Department. Both the U.S. and Canadian government claim that trade between the two countries generates over $1 trillion worth of commerce and investment annually, and is responsible for millions of jobs on both sides of the border.

But the trade relationship is far from equal. Publicly available data from the U.S. and Canadian governments, along with trade statistics from the UN, show just how critical business with the U.S. is to Canada’s economy. The U.S., on the other hand, is both less reliant on international trade than Canada and far less reliant on Canada as a trade partner than we are on the U.S.
The interactive map above lets you see how your home province depends on the U.S. for trade. If you click on the province, you will see the province’s exports to the U.S. represented by the blue dots, and the province’s imports represented by the red dots. Each dot represents $1 billion in traded goods.
By exploring the map, you will see that every province exports proportionally more to the U.S. than it imports. What’s more, each U.S. state exports less to Canada, as a proportion of total U.S. exports, than it imports from Canada.
To show you how closely Canada is intertwined with the United States, we gathered publicly available trade data from both the U.S. and Canadian government, along with the UN, and visualized this data in a series of animated maps.
Canada relies overwhelmingly on the US for trade

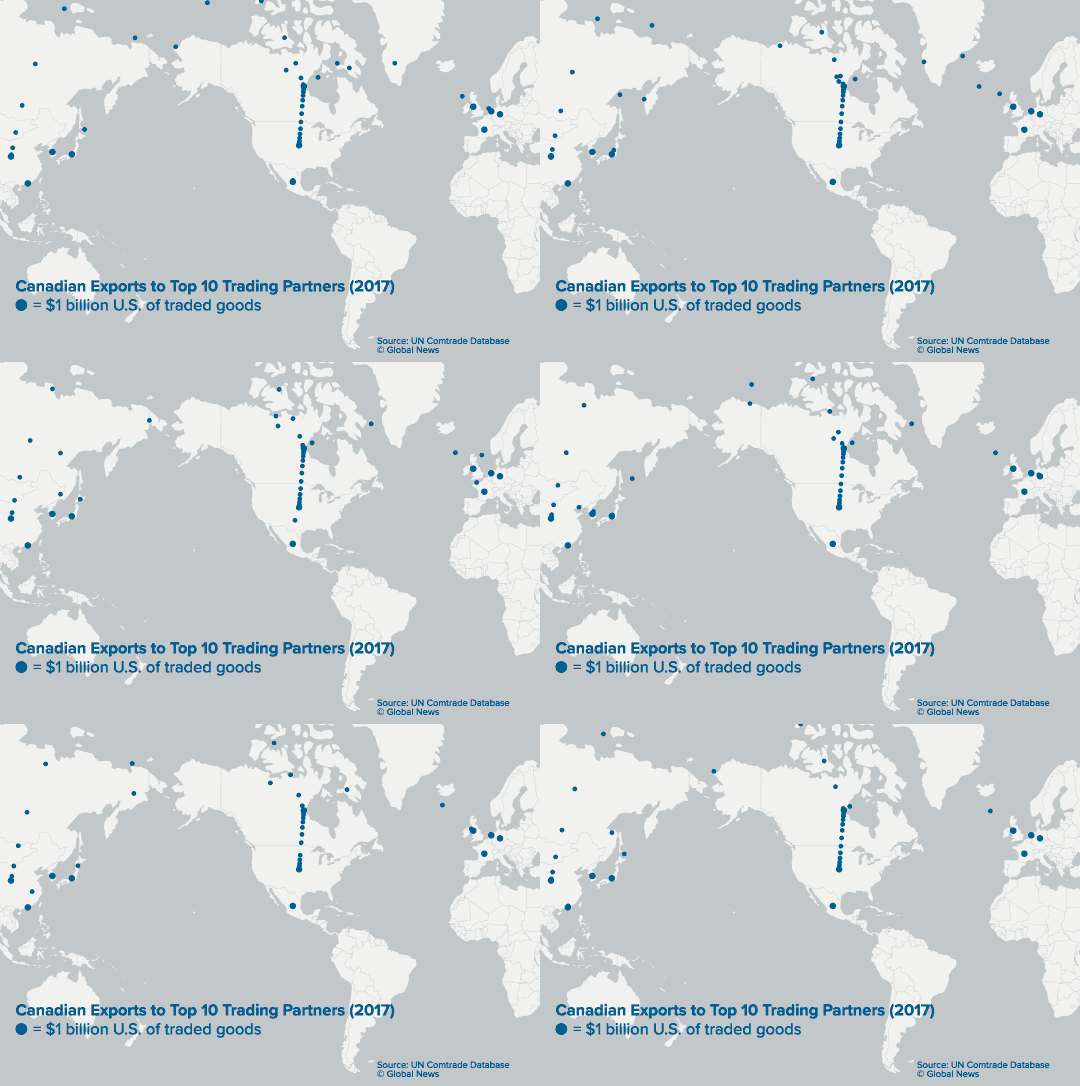
The map above shows the flow of exports from Canada to its 10 largest trade partners. Each circle represents one billion U.S. dollars in exported goods.
Over two-thirds of Canada’s exported goods were sold to the U.S. in 2017, according to data obtained from the UN Comtrade Database. In fact, Canada sold more than five times as much merchandise to the U.S. last year than it sold to its other top nine trading partners combined.
This singular reliance on the U.S. for exports can be seen in the animation above. Each dot represents $1 billion worth of Canadian exports. You can see that while Canadian international trade spans the globe from Germany to China, European and Asian exports are merely a drop in the bucket when compared to the stream of goods flowing south of the border.
Economists refer to this as export market concentration. According to University of Calgary economist Trevor Tombe, “Canada is the second least diversified country in terms of its export operations.” The least diversified export economy is Mexico.
“We stand out as being highly reliant on the United States,” he said.
The U.S. does not rely exclusively on Canada for trade

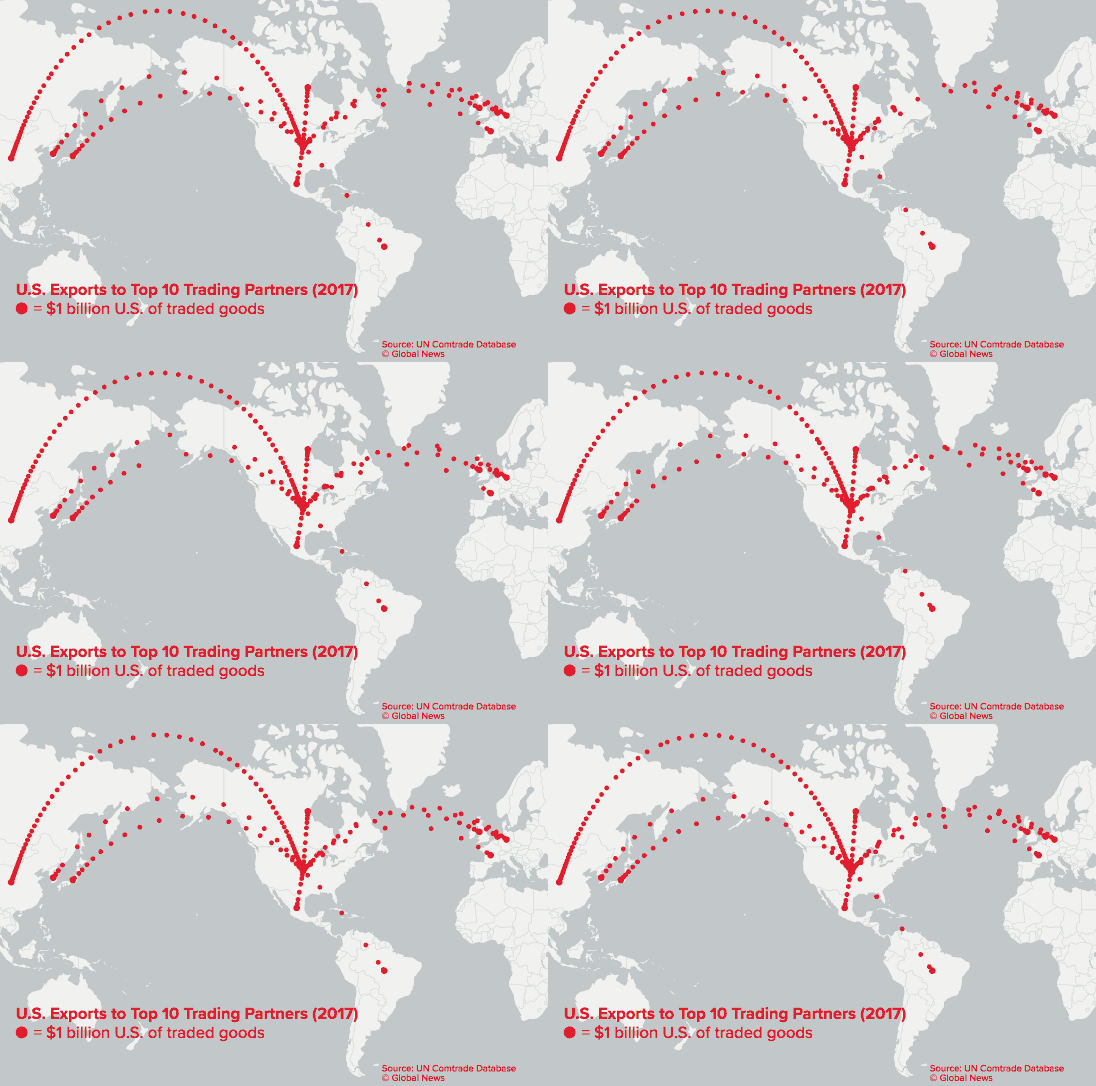
The map above shows the flow of exports from the U.S. to its 10 largest trade partners. Each circle represents one billion U.S. dollars in exported goods.
In contrast, the U.S. export market is much more diverse. Only 18 per cent of U.S. goods exported in 2017 were sold to Canada.
“The United States is not as reliant on us as we are on them,” Tombe says.
If this imbalance wasn’t stark enough, the U.S. economy also relies much less on international trade in general. According to the World Bank, international trade accounted for 64 per cent of Canada’s GDP in 2016 and only 27 per cent of America’s.
“There are only two or three states,” adds Tombe, “that have trade volumes with Canada more than 10 per cent of their economy.”
All of this is bad news for Canada in a trade war, Tombe explains, as it means the U.S. can negatively impact our economy much more easily than we can impact its economy.
Canada can fight back, if it targets products the U.S. sells almost exclusively to Canadians

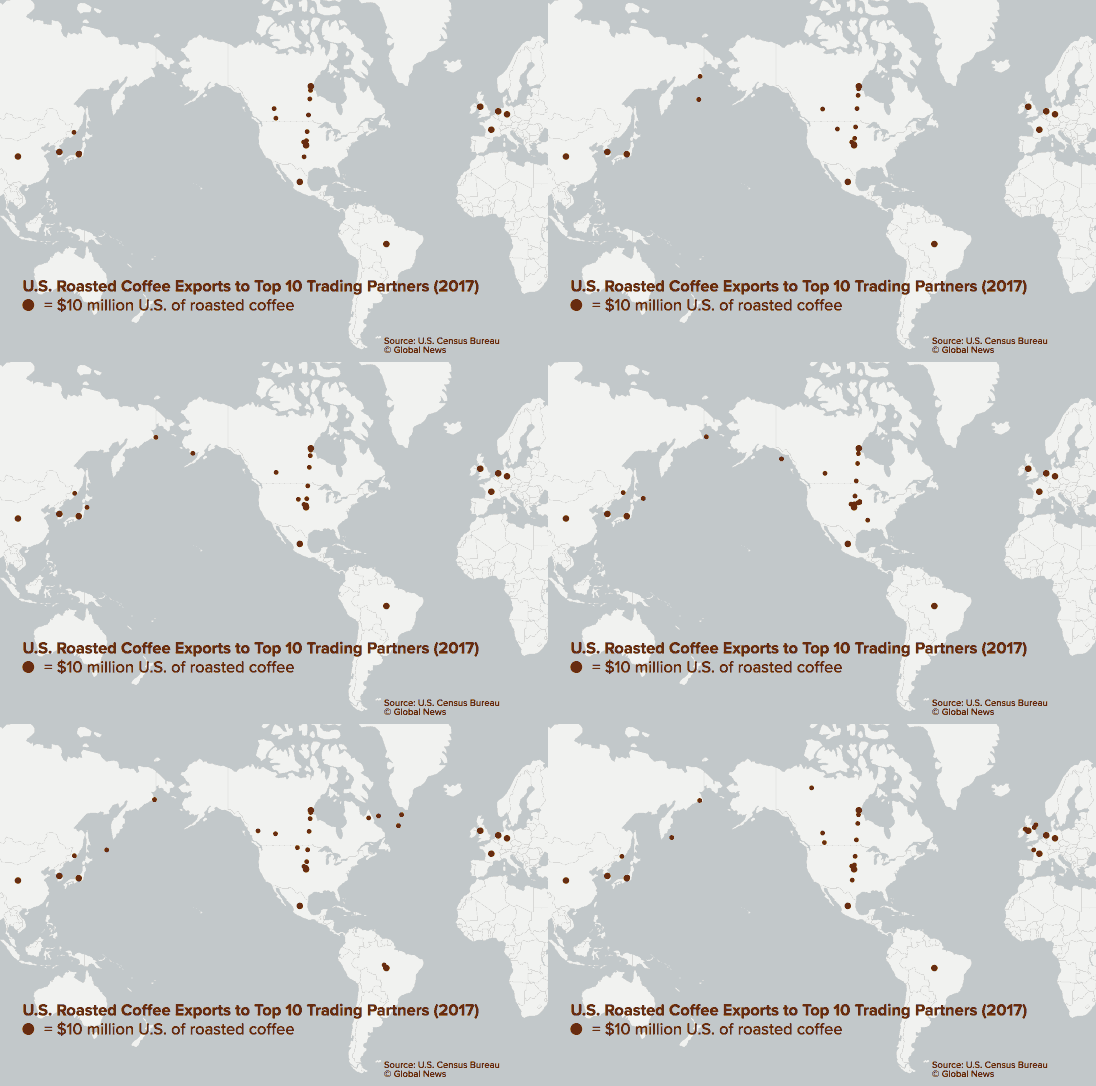
This map depicts the flow of U.S. coffee exports to America’s top 10 trading partners in 2017. Each circle represents US$10 million in coffee products. Most coffee exported from the U.S. goes to Canada.
Even though the U.S. sends less than one-fifth of its exported goods to Canada, there are some specific products the U.S. sells almost exclusively to Canadians. According to Tombe, these products present Canada with an opportunity.
“The goal of retaliation is to impose costs on the United States, not Canadian consumers,” Tombe says. “Of course, Canadian consumers will bear some of the burden, but the trick is to put a tariff on something that will force a U.S. producer to lower its price. And that happens when we are an important market for that producer.”
For example, 66 per cent of the roasted coffee exported by the U.S. makes its way to Canada. This flow of joe from U.S. producers to Canadian cups can be seen in the animation above.
Canadians also purchase 63 per cent of U.S. ketchup exports, 86 per cent of U.S. cucumbers and gherkin exports, and 88 per cent of U.S. toilet paper exports. We even consume more than half of the maple syrup exported by the U.S., despite Canada’s ample supply.
Canada’s retaliatory tariffs went into effect July 1 and target all the products listed above, along with many others. The full list of affected products can be found on the Department of Finance website.
“At first glance it might look a little funny, why we’re targeting certain goods,” Tombe says. “But the reasoning is, we’re trying to pick goods that we could actually influence the price of through the tariff.”
But while Canada can fight back, some experts are questioning if this is really a good move. According to McGill University political scientist Krzysztof Pelc, “The risk is misperception, thinking you can get the other side to back down. But of course, it does not back down and they escalate.”
Pelc’s concern is that each will continue to escalate until “both sides find themselves in a situation that no side really wanted to get into and there’s no way to draw back.”
It’s a concern made sharper by the tight grip the U.S. has on our export markets.
But the U.S. also has the ability to wreak havoc on Canada’s economy with geographic precision
In addition to being heavily reliant on the U.S. for trade, Canadian exports are also heavily concentrated in specific industries.
“Our exports are dominated by two large categories,” Tombe says. One is energy, the other is motor vehicles and car parts. “Those two things combined are the majority of our exports.”
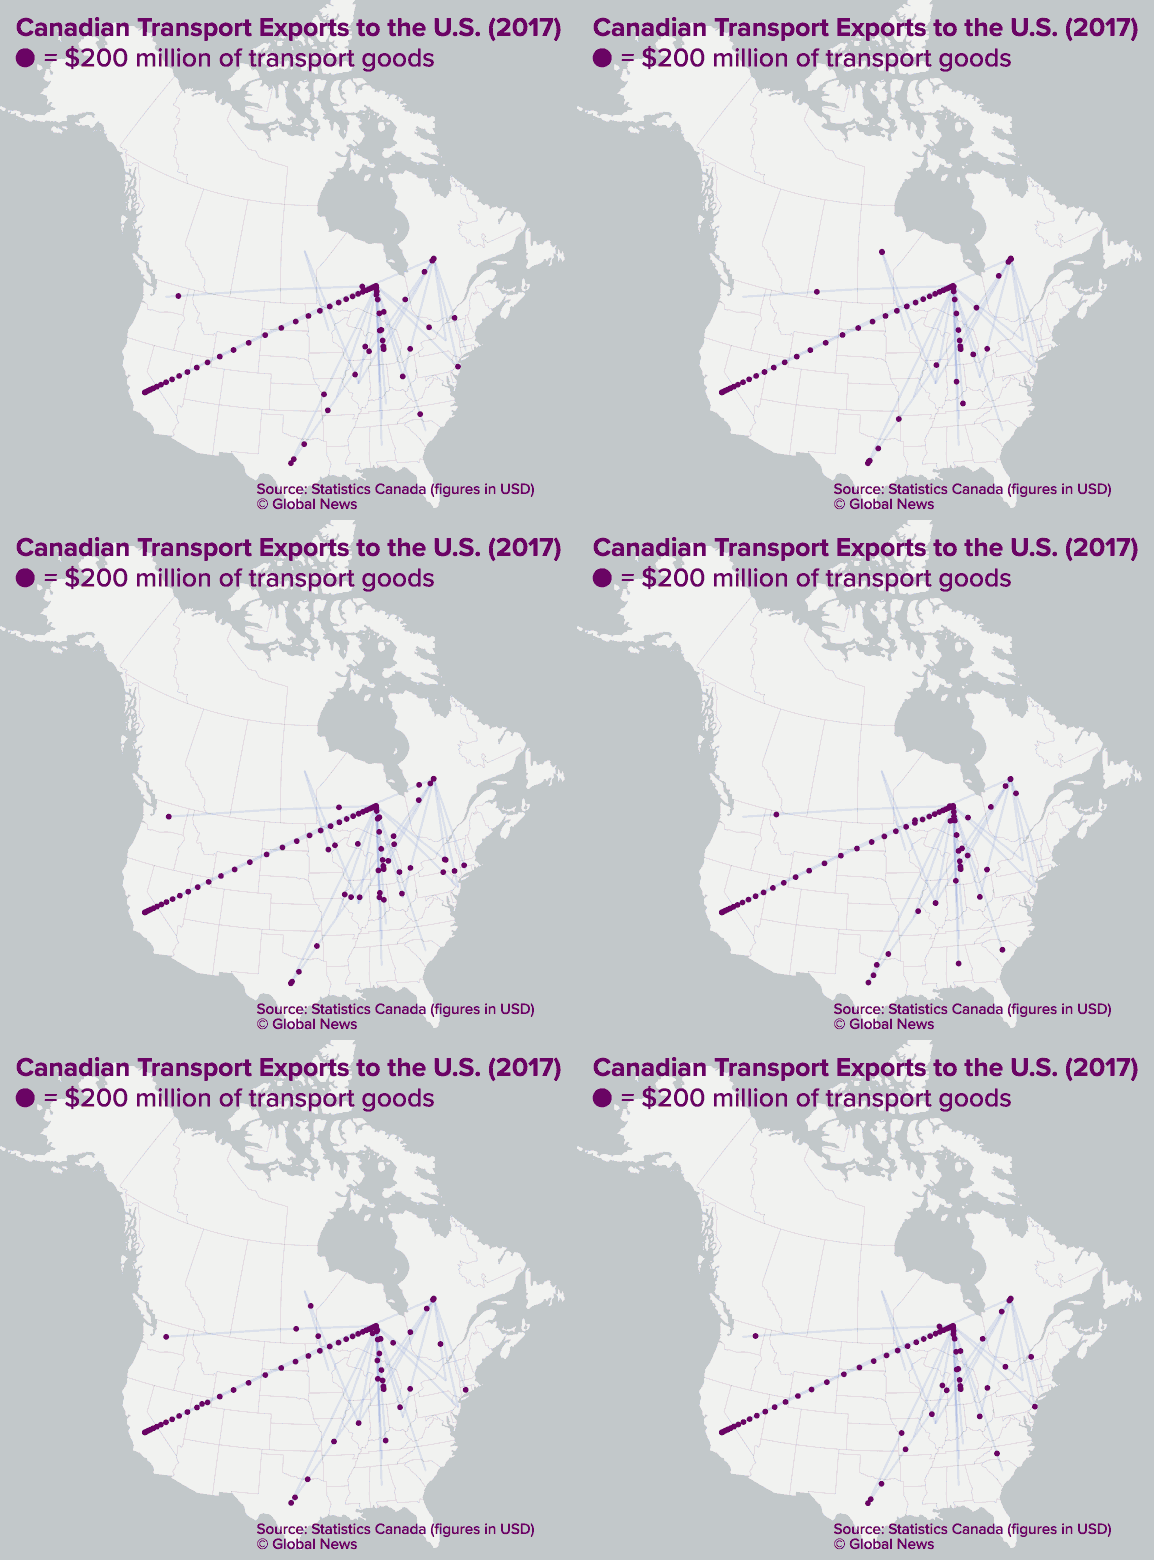
The vast majority of auto exports originate in Ontario, with production occurring to a much lesser extent in Quebec and Manitoba:

U.S. President Trump has recently threatened to impose a 25 per cent tariff on all final auto exports from Canada, a move which Tombe believes would significantly disrupt Ontario’s economy.
“With autos,” Tombe explains, “you have this very tightly integrated supply chain between us and the United States, where even small frictions can have dramatic effects on productions here.”
Tombe claims that “even small tariffs on autos might specifically reduce production in Canada on the order of 40 per cent or so.” And 25 per cent is no small tariff.
Of course, while these animations illustrate some of the basic economic facts underlying this trade war, predicting the outcome is a different matter. “All I’m sure of is this administration seems uniquely dismissive of careful analysis of the pros and cons of their policy decisions,” Tombe says. “And to predict the behaviour of a seemingly irrational actor is difficult.”
Political scientist Krzysztof Pelc suggests the outcome will come down to a simple test of wills. “Which side will be most patient?” Pelc asks. “The side that can put up with the most pain is likely to win.”
Note on the data: Trade statistics were drawn from the UN Comtrade Database, the U.S. Census Bureau, and the Government of Canada website. Value amounts are represented in U.S. dollars unless otherwise specified. All animations depict trade statistics from 2017. We attempt to limit our analysis to domestic exports, excluding re-exports where possible.
With files from Aalia Adam.


Comments