

Home affordability has deteriorated in Canada for almost four years now, to the point that paying for shelter would have taken up almost half your income in the first quarter of 2017.

So what have Canadians done? Gone south, if a report released by the U.S. National Association of Realtors (NAR) on Wednesday is anything to go by.
Coverage of foreign buying in Canadian real estate on Globalnews.ca:
-FOR_WEB_848x480_960411203609.jpg?w=1200&quality=70&strip=all)
-
![]() Home sales in GTA drop in May after foreign buyer’s tax introduced
Home sales in GTA drop in May after foreign buyer’s tax introduced -
![]() GTA real estate market cools down after sizzling first quarter of 2017
GTA real estate market cools down after sizzling first quarter of 2017 -
![]() Victoria now ranks 2nd in world-wide luxury real estate
Victoria now ranks 2nd in world-wide luxury real estate -
![]() Kathleen Wynne reverses course with foreign buyers tax, claims conditions have changed
Kathleen Wynne reverses course with foreign buyers tax, claims conditions have changed -
![]() Ottawa to close capital gains tax loophole for foreign home buyers
Ottawa to close capital gains tax loophole for foreign home buyers -
![]() BIV: August inflation numbers, impact of foreign buyers tax
BIV: August inflation numbers, impact of foreign buyers tax


_848x480_778153539912.jpg?w=1200&quality=70&strip=all)

The “2017 Profile of International Activity in U.S. Residential Real Estate” showed foreign investment in American housing hitting a new high, largely on the back of a “substantial increase in sales dollar volume from Canadian buyers.”
Foreign buyers and recent immigrants spent $153 billion on residential property in the U.S. from April 2016 to March 2017, representing a 49 per cent jump from the same period last year.
Much of this was driven by a surge in foreign buying from Canadians, who spent $19 billion in that period, compared to $8.9 billion in the previous one.
- Budget 2024 failed to spark ‘political reboot’ for Liberals, polling suggests
- Train goes up in flames while rolling through London, Ont. Here’s what we know
- Peel police chief met Sri Lankan officer a court says ‘participated’ in torture
- Wrong remains sent to ‘exhausted’ Canadian family after death on Cuba vacation
READ MORE: Foreign buyers concentrated in Toronto and suburbs after new real estate tax
The growth came as the Canadian dollar continues to slump against the U.S. greenback, though its value wasn’t seen to have changed much between the NAR’s last two reports, except for some recovery in the spring and summer of 2016.
But prices in Canada have increased so much that U.S. real estate is now proving competitive, Danielle Hale, the NAR’s managing director of housing research, told Global News.
One other factor driving Canadians to buy in the U.S. is that there are a number of American cities with lower prices that are close to less affordable options in the Great White North, Hale said.
“Prices have not increased as quickly in the U.S.,” she said.
The increase in foreign homebuying in the U.S. was also reflected in the average purchase price, which climbed from $332,072 in 2016 to $560,844 this year.
The median purchase price also jumped, from $223,310 last year to $288,615 in 2017.
These trends came as the share of Canadian non-resident foreign buyers (ie. people whose primary residence is abroad) fell from an 80 per cent share to a 73 per cent share.
This group usually buys property as an investment, for vacations or for visits to the U.S. lasting less than six months. Those properties are typically less expensive than primary residences.
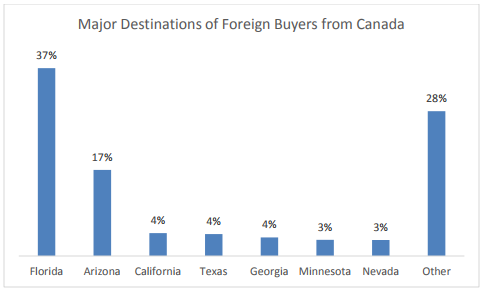
Most purchases nevertheless took place in parts of the U.S. known as vacation destinations, such as Florida (where 37 per cent of purchases happened) and Arizona (17 per cent).
But Minnesota also became a major destination for Canadian buyers, likely because of an increase in purchases by resident foreign buyers, who mostly live in the U.S. for work, study or other purposes.
Canada is on the up and up, but Chinese foreign buyers still rule
But Canadian buying still didn’t come anywhere close to activity from China, which accounted for $31.7 billion of sales this year, up from $27.3 billion last year.
The impact of Chinese money could also be observed in the average purchase price — foreign buyers from China spent an average of $781,801 this year, just over 39 per cent more than Canadians did.

But that figure also represented a nearly 17 per cent drop from 2016, when the average purchase price by Chinese buyers was $936,615.
READ MORE: B.C. foreign buyers tax really did yank down Vancouver home prices: BMO
Hale told Global News that increasing capital controls in China, meant to staunch the outflow of money from the country, could be one reason why buyers from there spent so much less on an average basis this year than last.
The controls didn’t, however, manifest in the number of Chinese buying real estate in the U.S., she said.
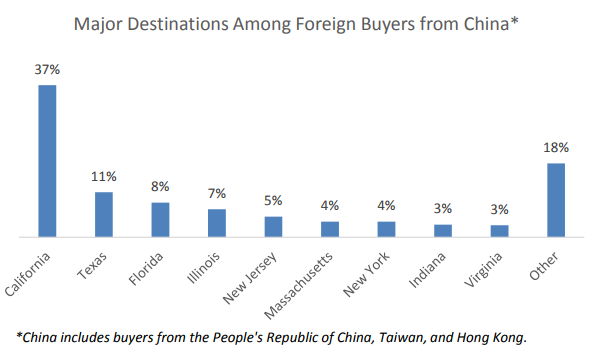
Most Chinese buying activities were concentrated in California (37 per cent), “likely because of its proximity to and cultural affinity with Asia,” the report said.
Other destinations for Chinese money included Texas (11 per cent), Florida (eight per cent), Illinois (seven per cent) and New Jersey (five per cent).
The NAR report also cited a Forbes story showing that Seattle was seeing a surge in interest from Chinese buyers after B.C. implemented a 15 per cent foreign buyers tax for the Metro Vancouver region.
READ MORE: B.C. foreign buyers tax really did yank down Vancouver home prices: BMO
Just like in Canada, the share of non-resident foreign buyers from China declined since last year, falling from 39 per cent to 37 per cent.
The report went on to say that the average purchase price among non-resident foreign buyers from all countries tends to be “higher than that of resident foreign buyers.”
The most recent stats had all non-resident foreign buyers paying an average of $626,814, compared to $473,469 for resident foreign buyers.
The NAR derived its data from a survey of 5,998 realtors that was conducted between April 10 and May 1.
The survey presented info about transactions that took place in the 12-month period between April 2016 and March 2017.
Comments